Recently there’s been an uptick in commentary about the U.S. market being on the high side of valuation. Some prominent investors are worried about stocks running out of steam. Below are some recent comments:
- Carl Ichan – some stocks are trading at 17 and 18 times the S&P. Those same stocks are going to whiff earnings. What rational person would buy that?
- Warren Buffett – if rates normalize, stocks would be on the high side on a valuation basis
- Janet Yellen – overall measures of equity valuations are on the high side
Before we can decide if the market is overvalued we should review how investors value the market. I believe a ratio called the “Price to Earnings” or P/E ratio is the most common measure investors’ use to value the market. The P/E ratio is calculated by dividing the Price of the S&P 500 by the S&P 500 earnings per share (price/earnings). It instantly tells us how expensive or cheap a stock or index is compared with its profits.
To complicate things investors use different versions of the P/E ratio, they are:
- “Trailing P/E ratio” (which uses the past twelve months of earnings)
- “Forward P/E ratio” (which uses forecasted earnings for the next 12 months or the next fiscal year)
When valuing the market investors generally use a “forward P/E ratio”. Specifically, they use the calendar year 2015 forecasted S&P 500 earnings. We use this also and currently it looks like this for the S&P 500:
S&P 500 forward P/E = 2,085 (S&P price) / $119.30 (estimated S&P earnings) = 17.5X
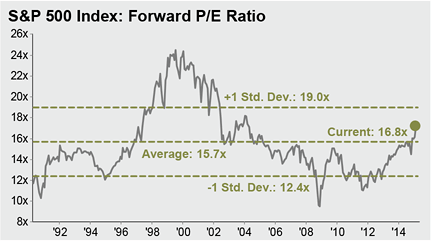
We know the market is currently valued around 17X P/E, is this overvalued? Below is a 25 year historical chart of S&P 500 forward PE ratios
We see the forward P/E ratio is currently above its 25 year average of 15.7X, but nowhere near the peak valuation of 24X back in the internet bubble of 2001. I would say the market is fairly valued right now.
The common assumption is when P/E ratios are below average, the market is cheap and future returns will be good. And when the P/E ratio is above average returns will be lower.
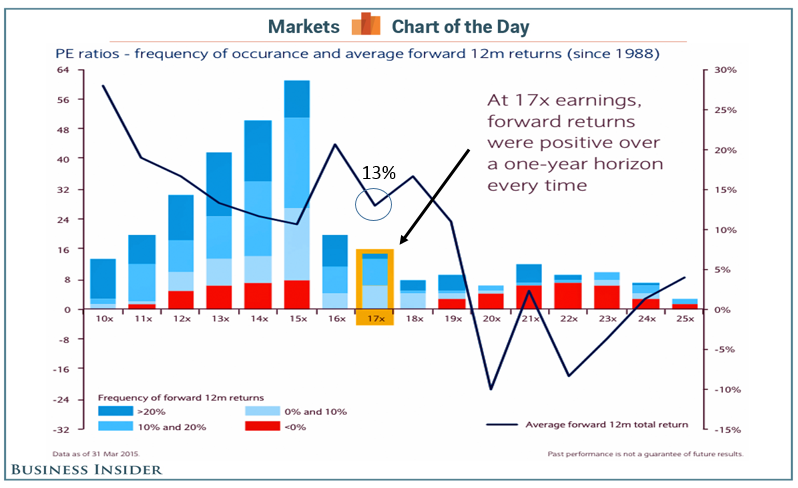
But what does history tell us about returns and forward P/E ratios? The chart below from Barclays sums up future 12 month stock market returns at different forward P/E multiples in one chart going back to 1998.
This is a busy chart, but it tells us:
- When the market has traded at a 17X forward P/E multiple in the past, the next years returns were always positive (blue shading in the bar chart)
- The average 12 month returns (dark blue line) were 13% when the market traded at 17X
- The market has traded at a 15X P/E multiple the most (61 months, height of the bar)
- Even at a 16x and 18X forward P/E multiple, next years returns were always positive
- Only when the forward multiple gets really expensive at 19X or greater do the chances of market losses (red shading in the bar chart) come into play
So what does all this mean?
Gradient is currently forecasting a flat U.S. stock market for 2015 (let’s say 0-5%). Building this forecast we acknowledge the market is fairly valued and thus earnings growth is critical to driving stock prices higher. Unfortunately, the combination of the strong dollar and the collapse in oil prices will keep S&P earnings growth fairly low this year, therefore our prediction for a pause in the bull market in 2015, even though history tells us the market will have a positive year.
We certainly do not see a bubble in the stock market and do not recommend selling. In fact, looking out to 2016 we think earnings will start to grow again (about 12%) and better returns can be expected. We also see opportunity in the international markets this year as they play catch up with the U.S markets. The ETF Endowment Series provides investors with exposure to these foreign markets as well as alternative investment asset classes.
As of May 6th, 2015:
Dow Jones US Moderately Conservative Index is up 1.43% (TR) for the year
S&P 500 closed at 2,076.05 up 1.43% for the year
Russell 2000 closed at 1,214.32 up 1.32% for the year
U.S. 10 year Treasury Futures are yielding 2.24% up 0.07% for the year
WTI Crude Oil futures closed at $60.70 up $6.99 for the year
Gold closed at $1,191 per ounce up $8 for the year
To expand on these market reflections or discuss other portfolio strategies please don’t hesitate to reach out to us at 775-674-2222.


