So far, 2017 S&P 500 performance has been relatively strong. Through April, the S&P 500 returned 7.16%. An interesting dynamic of this performance has been the re-emergence of Facebook (FB), Amazon (AMZN), Netflix (NFLX), and Alphabet (GOOGL), or taken as an acronym, the “FANG” stocks. This market reflection will concentrate on the performance of the “FANGs” and other stocks that have driven market performance this year, and what that means for GI portfolios.
For a bit of history, the “FANG” acronym began to catch on in 2015. The FANGs were singled out as a result of:
- the growth-oriented nature of these companies
- their significant outperformance compared to the market
The chart below illustrates the “FANG” stocks significant outperformance versus the S&P 500 during 2015 (green), their underperformance in 2016 (blue) and their re-emergence in 2017 (yellow):
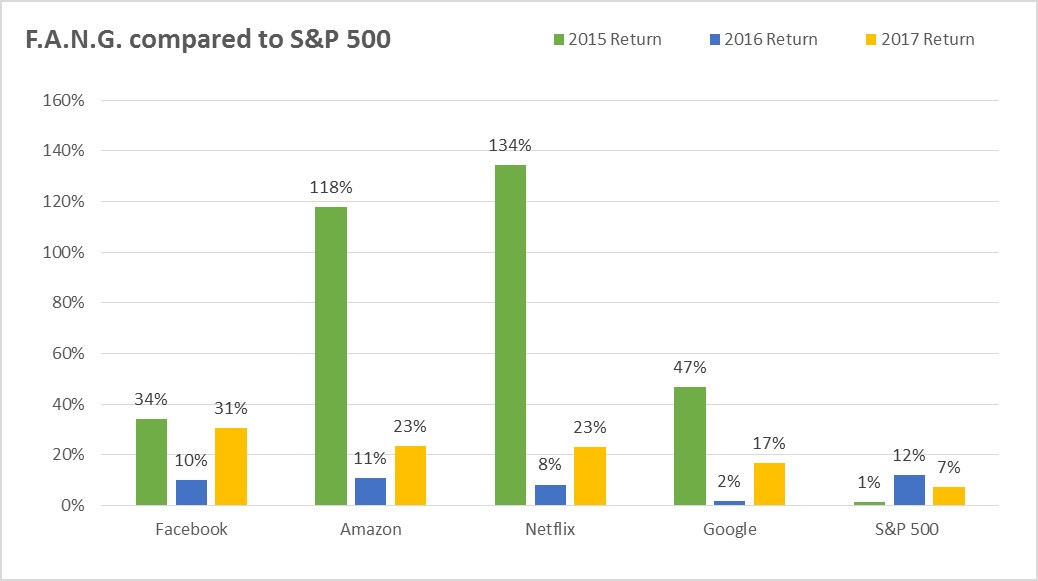
As a result of their size, the “FANG” stocks can have a large effect on the performance of the S&P 500. This is because the S&P 500 is a market-capitalization weighted index, which simply means that larger companies carry more weight and have a more significant effect on the performance of that index. In aggregate, the “FANG” stocks represent over $1.6 trillion in total market-capitalization. As an example, if the S&P 500 were an equally weighted index, the “FANG” stocks would be 0.8% of the total weight of the index (4/500 = 0.8%). However, because the S&P 500 is a market-capitalization weighted index, the “FANG” stocks represent a combined 6.5% of the total weight of the S&P 500.
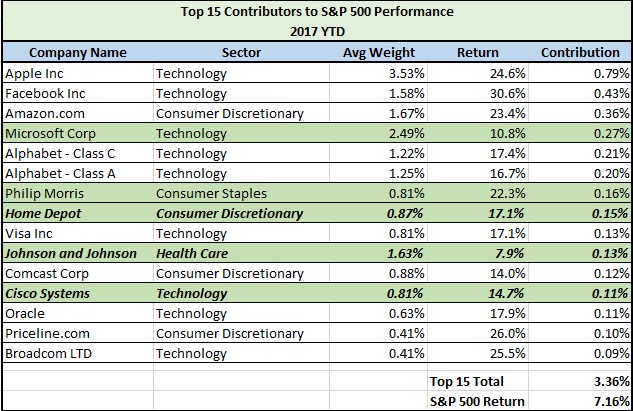
In addition to the “FANG” stocks, there are other large cap stocks that have had a significant effect on year to date market performance. The data below shows the top 15 contributors to the S&P 500 performance year to date. The performance contribution from the top 15 stocks has been 3.36% in total, which represents 47% of the 7.16% year to date performance of the S&P 500.
How do the FANG stocks differ from Gradient 50 (G50) positions? The answer is DIVIDENDS. The G50 would not be invested in “FANG” stocks, as none of those companies pay dividends. As a reminder, the G50 portfolio invests in high-quality, blue chip companies that pay attractive dividends.
From the list above, only 5 stocks meet the G50 investment criteria of a high quality company with a superior dividend yield (highlighted in green). The G50 currently owns 3 of those 5 (in bold). Apple (AAPL) was also owned in the G50, but was sold in late January as the stock’s dividend yield fell below our hurdles. Therefore, in times when non-dividend paying stocks are driving the performance of the S&P 500, we understand that G50 performance may differ from the overall market.
Our team believes in the long term value that the G50 and high-quality, dividend paying stocks provide for growth and income investors. We have a strict investment process when selecting investments in the G50. While we certainly don’t discount the merit of owning growth companies like the “FANG” stocks for certain investors, we believe that these investments are suitable for a different type of portfolio, such as our growth oriented Gradient 33 (G33).
For the G50, as with all GI portfolios, we believe that adhering to our specified investment process is the best way to create a portfolio strategy that balances individual investor risk and return objectives.
To expand on these Market Reflections or to discuss any of our investment portfolios, please do not hesitate to reach out to us at 775-674-2222