Value/Dividend Paying U.S. Stocks Rebounding on Fundamentals

Growth stocks out-performed the overall market for the two years ending December, 2015. During that time growth stocks rose more than 15% while the S&P 500 rose by nearly 12%. Value stocks during the same time rose just about 8%. But conditions have begun to change.

We all understand what growth means, but just what do we mean by value stocks? They are those with the lowest valuations based on price to earnings (P/E), price to sales (P/S) and price to book value (P/BV). Over longer periods of time, many stocks move, or rotate, from growth to value and sometimes back again.

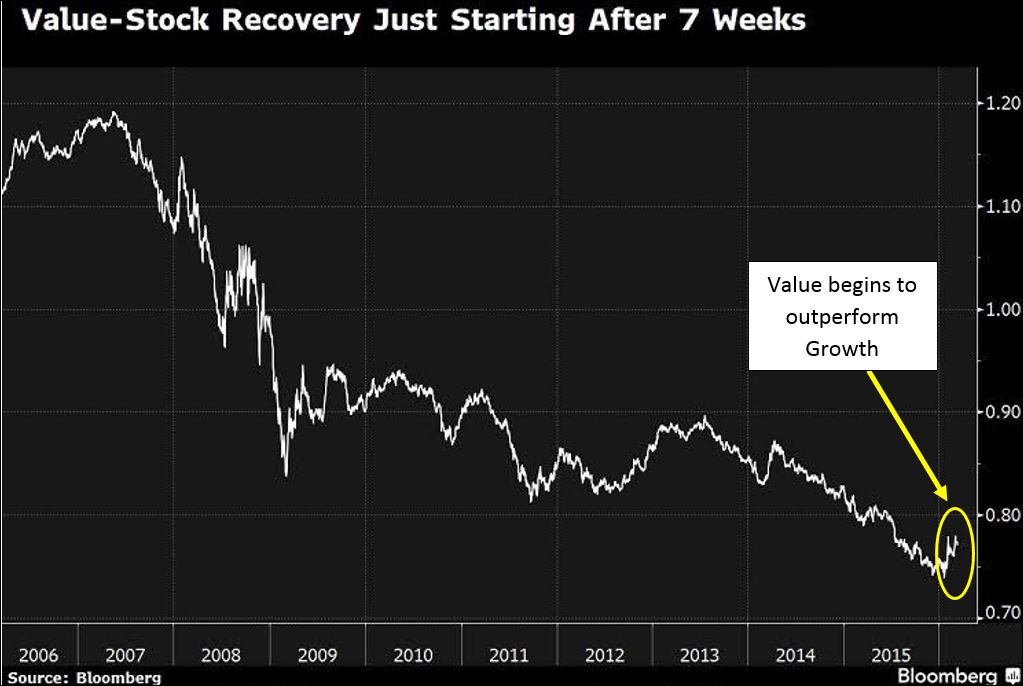
The dynamics that caused under-performance for value stocks for nearly two years have changed over the last two months. We can see this in the chart below where the line represents the ratio of the S&P 500 growth and value indices:

March 16 Mkt Reflection chart 1

Why have value stocks, particularly larger value stocks, under-performed for the last two years? We’ve had a few key headwinds:

· Growth in Europe and the emerging markets was slowing, affecting sales for large multi-national companies.
· The rising value of the US dollar challenged overseas sales and earnings growth for most US-based multi-nationals.
· Commodity prices, including oil, fell for three consecutive years which affected sales and profits for companies that rely on commodities for revenue.

In 2016 we have begun to see these headwinds turn into tailwinds:

· Oil prices have recovered from $27 per barrel, a 13-year low, to over $40 per barrel. We believe prices have likely bottomed and that the price will rise to the $50-60 range in 2016. What will drive the decline is falling non-OPEC production and increasing overseas demand, driving down inventories below expectations.
· Steady, low interest rates from the Federal Reserve since December are causing the US dollar to weaken to $1.12 per Euro from a low of $1.05 over the last four months.
· In commodities, plans are now in place to reduce supply, driving most commodity prices higher as global economic demand appears to be improving. We can see this in prices for most major commodities and also for shipping costs on a wide variety of commodities, which are recovering from a 30-year low.*

Apart from valuation metrics, we’ve seen those large cap, value stocks with their strong dividend yields gaining appeal as bond yields remain lower for longer. For instance, a market basket of large cap value stocks yield 2.8%** versus just 1.9% for 10-year US Treasury bonds.

Meanwhile, many fast growth, high valuation stocks winners of last year are faltering. For example, Amazon (AMZN) trades at 122 times forward estimated earnings per share, two times sales and 20 times book value. It pays no dividend. Year to date the stock price is down about 17%.

The Gradient 50 is an equally-weighted portfolio of 50 blue chip, dividend paying stocks that have these desirable low valuation characteristics. The G50’s total return (price plus dividend income) is out-performing the broad US stock market by over five percentage points year to date. We believe it is well positioned to outperform for the rest of 2016 since these companies tend to be:

· larger market capitalizations with exposure to higher growth in global markets
· paying dividends that yield 3.7% on average
· priced at lower P/E, P/S and P/BV valuations than the market average

Markets usually extend a trend longer than investors anticipate. For now Nevada Retirement Planners would prefer income and growth oriented investors allocate new equity dollars into the G50 portfolio. We continue to believe that market fundamentals will drive stock prices. These fundamentals are determined by the health of the overall economy and the profitability of the companies that operate within the economy.

To expand on these Market Reflections or to discuss any of our investment portfolios, please do not hesitate to reach out to us at 775-674-2222

*Source: “Baltic Index Slips Further, Hits New Record Low,” Reuters 2/10/2016

** Source: Vanguard VTV ETF fact sheet

Posted on March 23, 2016 Read More

Year of the Monkey

The Chinese New Year was celebrated in early February and enter the year of the monkey. After the celebration the Chinese stock market rallied in true New Year’s fashion. Their enthusiasm spread to both the European and U.S. stock markets giving the world a much needed boost from the current pullback.

All the recent attention to China reminds me of a fabulous Chinese Proverb. “The best time to plant a tree was twenty years ago. The second best time is now.” When advisors and clients inquire about the best time to buy stocks or invest money, a confident and truthful response can always be “the best time to invest was twenty years ago, the second best time is now.” The twenty year time horizon gives the proper perspective to a long-term mission. The proverb also instills hope. Long-term goals can be achieved if you start the process and stay committed.

The January stock market sell-off continued into early February. By the eleventh day, U.S. stocks bottomed and mounted a rebound turning negative results into flat returns for the month. International stocks followed a similar path and posted small declines in February. One thing for sure this year is higher volatility. Triple digit moves on the Dow Jones Industrial Average is now commonplace. This trend is likely to continue as the Federal Reserve charts a globally divergent course on monetary policy, oil prices remain uncertain, currencies are in flux, economic growth is fragile, geopolitical risks run high and the 2016 election cycle appears to be one for the ages. Expect volatility to remain high this year.

U.S. stocks finished mixed for the month as larger capitalization stocks outperformed smaller capitalization stocks. The S&P 500 and NASDAQ Composite finished down 0.13 and 1.03 percent respectively, while the Dow Jones was up 0.75 percent. International stocks as measured by the MSCI EAFE and Emerging Markets were down fractionally at 1.83 and 0.16 percent. New leadership emerged from the defensive sectors as utilities, metals and mining and consumer staples led the market back to flat for the month.

The equity market rebound pumped life back into credit sensitive bond sectors. High yield bonds, battered from the recent flight to quality trade, reached valuations too cheap to ignore. The February wide credit spread mark (as measured by the Bank of America Merrill Lynch US High Yield Master Spread) reached 8.87 percent on the day stocks traded at their monthly lows. In the last two and a half weeks, high yield spreads tightened over one hundred basis points bringing high yield bond prices back to their monthly starting point. This is good news for bond investors.

The 2016 bond market will provide relative cover for those investors looking for a break from higher volatility. Expect one 25 basis point Fed rate hike in the second half of the year and overall interest rates to remain low, just as they did last year. One to three percent total returns should be your bond market expectations from here.

A closing thought in the face of higher market volatility. It is important to remember capital markets do not move up or down in straight lines. Since March, 2009, the stock market rally has been quite remarkable. Along with success, comes regular price pullbacks along the way. The recent 10.4 percent pullback is no exception. As you can see below there have been thirteen other pullbacks as the S&P 500 journeyed from 666 to 1,932 over the past seven years.

Pullbackssince2009

The secret to the long-term success of planting trees twenty years ago is the commitment to leave the trees in the ground for the entire time. The secret to the long-term success of investing is the ability to stay invested for the entire time. Unfortunately, every market pullback becomes an emotional challenge to your financial commitment. Since it is the year of the monkey, take the monkey off your back and keep your investments planted for the long haul.

MARKETS BY THE NUMBERS:

Feb2016

To expand on these Market Commentaries or to discuss any of our investment portfolios, please do not hesitate to reach out to us at 775-674-2222

Posted on March 2, 2016 Read More

Why Include Gold in Your Portfolio Now?

Gold serves several purposes in a portfolio. For the last four years, there has not been much interest in the metal, but investors have been buying recently.

In fact, the price of gold is up 15% year to date, its best start to a year in 35 years as it outperformed stocks. See chart below* illustrating the performance of Gold (black line) versus the S&P 500 (blue line).

Feb 16 Monthly Reflection 1

What’s driving the gains after years of under-performance? It’s the various roles that gold serves:

a) risk reducer in a volatile environment
b) protection against inflation
c) retention of purchasing power
d) protection against any possible decline in the U.S. dollar
e) a safe haven from “black swan” events

Let’s take a deeper look into each of these roles.

a) Gold is a non-correlated asset class, meaning that it doesn’t move in the same direction as the price of stocks or the price of bonds. The addition of gold can potentially reduce risk in a portfolio. In a volatile environment, as we saw in the Chinese stock market at the beginning of the year, it is actively sought out. We saw this in the sharp rise in money flows to precious metals funds in the first several weeks of this year as shown in the chart below.** Inflows haven’t been this strong since 2009.

Gold Money Flows

b) Gold protects against inflation as it retains purchasing power by rising in value during inflationary times.

c) A handful of countries overseas are actually charging customers to keep their money in a bank these days, a complete reversal of traditional interest payments to depositors. Fear that this new practice will occur in the US as well is partly responsible for the recent gains in gold prices.

d) Gold protects against declines in local currencies. In fact, it often moves in the opposite direction of the US dollar. The US dollar has strengthened over the last two years versus most of the world’s currencies. If this reverses, we believe investors would benefit with a position in gold.

e) In the event of global upheaval, be it caused by terrorist attacks, war or any other unexpected geopolitical or financial shock, gold can be relied upon as a store of value. During these “black swan events”, gold prices rise as the metal becomes a go-to currency.

Currently gold is still less than 1% of global investors’ portfolios. It continues to be under-owned despite the recent price appreciation. With limited supply, this leaves the potential for further price appreciation. You could buy gold bars, metal coins, stocks or mutual funds holding gold miners. Exchange traded funds (ETFs) provide flexibility since they are priced daily, are highly liquid and track the price of gold accurately.

At Nevada Retirement Planners, we currently include a gold ETF in our Endowment Series. Gradient’s Precious Metals portfolio is our most direct method to benefit from higher precious metals prices. The portfolio includes positions in gold along with silver, platinum and palladium. In addition, precious metal mining company stocks are included.

In summary, precious metal investing can be volatile, but a reasonable allocation to this asset class over time can be beneficial.

To expand on these Market Reflections or discuss any of our investment portfolios, please do not hesitate to reach out to us at 775-674-2222

Sources:

* Yahoo Finance interactive charts ** Bank of America Merrill Lynch, EPFR Global

Posted on March 1, 2016 Read More

News Archive

Call Us: (775) 674-2222