China Pressures – A Not So Happy Start to the New Year

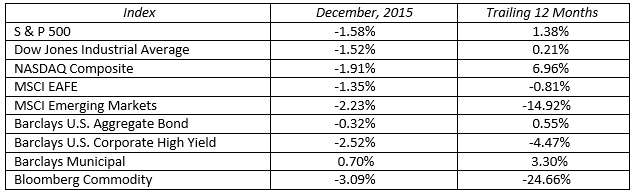
Stock markets around the globe fell in the first few days of the new year, for the worst opening week ever. It started in the mainland Chinese stock markets and dragged down Europe and the US also. In the process, the S&P retraced all of its gains since the end of September. What was the cause for of all this?

· Before the start of Monday’s trading a major indicator of Chinese economic growth, their manufacturing purchasing managers’ index, was reported below expectations and at the lowest level in three months.

· Retail investors in China rushed to sell stocks, also in anticipation of the lifting of a ban on sales by major shareholders at the end of this week. Note that their market is highly volatile and dominated by a small group of local individuals, not professional traders.

· New rules governing the closure of markets in the face of increased volatility further drove markets down.

· The Chinese central bank cut interest rates in each day for eight days to stimulate borrowing, help drive economic growth, and stem the market decline.

· All of these factors drove the value of the Chinese currency down.

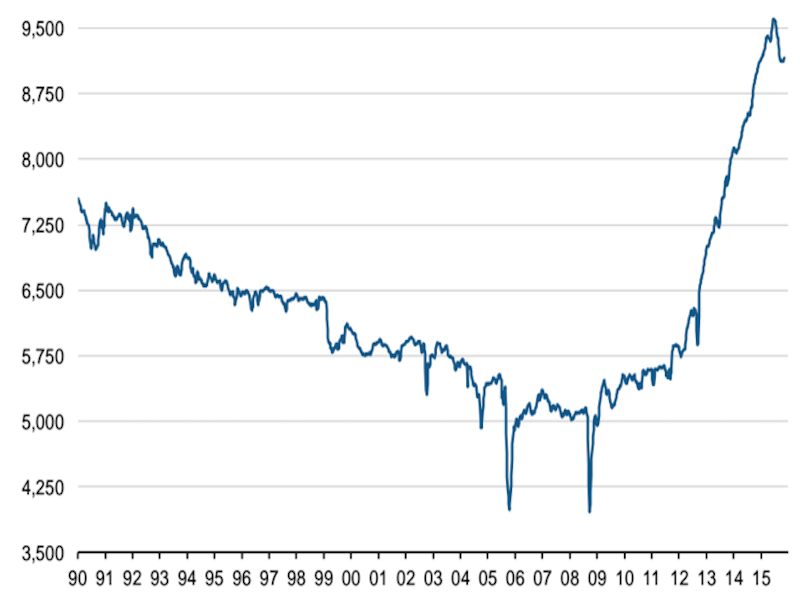
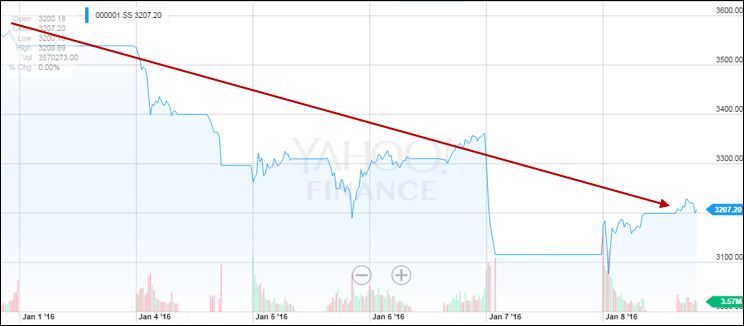
· After four days, the Chinese stock index was down 21% from year end (see the chart below).
Chinese Stock Market New Year 2016
China appears to have been growing its economy in the 7-9% range for each of the last few years, well ahead of the vast majority of other countries. We think this has been moving, gradually, toward a 5-6% growth range over the next few years. This would be still positive and well ahead of other major countries. So a slowing in Chinese economic growth should not be a surprise.

On the news, stocks sold off. The Chinese government worsened the sell-off with their new “circuit breakers” or the automated closing of stock markets triggered by a 7% change in stock values. In general, circuit breakers are designed to stabilize the markets by allowing for a cooling off period for frantic stock holders. The Chinese closed their markets twice on Monday and again early Wednesday, obviously not having their desired effect. We are now hearing reports that they have suspended circuit breakers indefinitely.

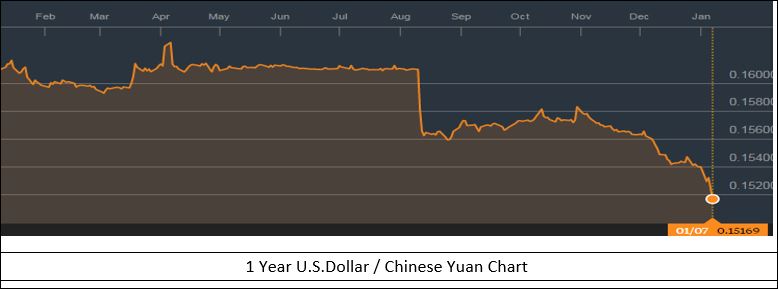
With anxiety over slowing growth and increasing financial controls, the Chinese people are attempting to move their money out of the country. As the money flows out, their currency (the yuan) comes under pressure. Government actions last August and again in December were insufficient to support the yuan, so deflation becomes more likely. This also spooked the markets, and drove the value of the yuan to fresh five year lows. See the chart below.
Chinese Yuan 1 year chart   1 8 16
We believe the devaluation of the yuan will likely drive additional capital outflows in the coming weeks. As capital flees China where does the money go?

Over the last few years we’ve seen it go into real estate in Canada, the US and other parts of the world. For those seeking more easily traded or “liquid” assets, US Treasuries are looking safe and attractive with roughly 2% yields. This compares to German bonds which yield about 0.50% and some other European government bond yields with negative yields. US dividend paying stocks are also looking attractive with an average 2% yield on the S&P 500.

The concept of slowing Chinese growth is highly emotional and, in terms of impact on US companies, we believe it is somewhat isolated. US exports to China represent less than 1% of our economic output, while American multinational companies generate only 2% of their profits from China. But as a competitor, cheaper goods from China could prove to slow sales of US based companies to the rest of the world and push down prices.

Of course China being China, their government also came in on the fifth trading day of the year to buy shares, providing support to the stock markets. European stocks finished the week down 6.5%, and the broad US market closed down 6%.

We believe US markets remain attractive with S&P companies trading at a slight 10% premium to their ten year average forward price/earnings multiple, with 8-10% earnings growth estimated over the coming year.

Posted on January 11, 2016 Read More

Tough Sledding

Last year proved to be a challenging year for all market participants. The markets did not discriminate. Whether you were a top hedge fund manager, Warren Buffet, a seasoned investor or someone new to the game, 2015 frustrated everyone. Usually there is one star asset class separating winners from losers. Not so in 2015. Even 2008 had its star performer when long-term U.S. Government bonds returned 28.8 percent in an otherwise disastrous year.

There were no performance champions last year. While most major asset class avoided huge declines, there was plenty of pain in some of the sub-sectors. Most investors owning a diversified portfolio in 2015 saw their money go nowhere or decline in value. The flat to down returns are not a surprise when you analyze the various asset categories.

The U.S stock market was basically flat for the year with a wide dispersion of returns among sectors. Consumer discretionary was the best performing S&P 500 sector up 7.3 percent, while energy was down 24.0 percent. International stocks from developed countries were down 0.8 percent and emerging markets were down 14.9 percent for the year. There was a lot of hype and speculation regarding higher interest rates, but very little changed. Short-term Treasuries were up a bit, long-term Treasuries and corporate bonds down a bit, while high yield bonds suffered from the plight of the energy sector. For the doom and gloom gold bugs, they saw their value drop by 11.4 percent and broader commodities fell by 24.7 percent

In the big picture, the markets were due for a lackluster year. It’s been a great six year run and year seven was a blah investment year. The past is the past, and what matters now is where do we go from here?

While it is not wise to expect miracles in 2016, we believe it is fair to expect reasonable returns despite a tough first week. For stocks, mid-single digit returns would qualify as reasonable. U.S. stocks will face lighter headwinds in 2016. Stocks will benefit from continued low global interest rates, an eventual bottoming of oil prices, moderation of dollar strength, resilient consumers, and favorable earnings comparisons in the quarters ahead. Global stock markets still need to contend with slowing economies, differing central bank monetary policies, commodity price direction and heightened geo-political risk. International and emerging market stocks may catch enough of a tailwind from local currency weakness to boost their income statements and relative stock performance.

The bond market waited all year for the much anticipated Federal Reserve rate hike. This year may prove to be an instant replay of last year. Once again, everyone is expecting higher rates and multiple Fed moves. In reality, the Fed will talk a good game but likely leave rates alone creating a stable yield curve. The yield on the ten-year Treasury may stay in the 2.0-2.5 percent range waiting for a meaningful change to the macro environment. Expect bonds to be boring with low single digit returns into the foreseeable future.

In the past few years the importance of long-term diversification has been lost with the consistent superior performance of U.S. equities. Times may be changing. Diversified portfolios are still the vehicle of choice when travelling long distances. Stay your course for the long haul.

MARKETS BY THE NUMBERS:

Dec2015

Posted on January 6, 2016 Read More

The Energy Markets

Oil prices dived again last week as oversupply woes continued to weigh on the energy sector.

See the chart below, it’s pretty dismal:

oil_image1

OPEC has stated they will not cut production at their most recent meeting and US production remains close to its highs, thus inventory levels are at record highs across the globe. Bottom line is that over supply still exists in the crude oil market

See the chart of US production below:

oil prod_image2

Even though production from existing capacity is still high in the US, operational oil drilling rigs are falling dramatically. The US oil rig count fell this week to 524 (down from over 1,600) according to Baker Hughes. This brought the tally to the lowest level since April 30, 2010. This will eventually curtail US growth in production as existing wells deplete.

The chart below shows the rapid decline in oil rigs operating in the US:

oil rig count_imgae3

Banks are also starting to reduce lending to energy companies. In September, banks based their lending decisions on a price of $48 a barrel, down from $77 last year. That means energy companies will not be able to borrow nearly as much as they used to.

Adding to the problem is oil price hedges will continue to expire, exposing oil producers to the cruel realities of the bear market. Somewhere around one-fifth of U.S. oil production was hedged at $80 to $85 per barrel in 2015. Half of those hedges will expire in 2016.

Because of this access to finance will become tighter. Lenders to the energy sector are getting burned as the value of high-yield energy debt has collapsed amid speculation that a wave of defaults could be coming. Lenders have been lenient with debt laden oil producers, but deep losses on bonds from junk-rated U.S. energy firms are rattling investors. Strategists forecast:

  • The high-yield market to have a 5% default rate in 2016 (it’s been about 2% the last several years)
  • Commodity-related sectors to show default rates moving from 7% to 12%


On top of this most other commodities have seen sharp declines. The S&P GSCI commodity index has fallen more than 46% in the last 12 months. Investor attitudes on commodities have changed. From the mid-2000’s onwards, commodities were seen widely as an investable asset class. This perception has now unwound, to be replaced by an aversion by investors towards the sector. It’s estimated that total dollars in the top 10 commodity funds globally have fallen from more than $50 billion in 2008 to less than $10 billion today.

So as oil hits 10 year lows everyone has now turned bearish including both Wall Street and Main Street. The experts who used to see oil prices going to $200, now see it potentially going into the $20’s.

But not everyone is abandoning ship, and some brave souls see opportunity:

David Rubenstein, co-CEO of Carlyle Group sees the current situation with oil prices as perhaps one of “the greatest energy investing opportunities we’ve ever seen.”

Oaktree Capital co founder Howard Marks said his firm was ready to catch falling knives, “I think $37-dollar oil will present a lot of opportunities, I think $30 will present more.”

Scotia Howard Weil notes after a difficult 2015, in which oversupplied crude & natural gas markets drove the respective commodities to abysmal levels, they see the potential for 2016 to recover some eroded value. While not forecasting an overly bullish environment next year, firm does think the stocks look well-positioned for a better year, especially companies with good balance sheets.

Guggenheim has become bullish on the oil services sector for the first time in nearly two years, for three reasons:

  • They believe that the global oil market will begin to tighten in 2Q16 and that oil prices will rise further and faster than the “lower for longer” consensus expects, reaching $100 per barrel by 2018
  • Energy’s low S&P weighting and high short interest suggest that supply and demand for oil services equities is out of balance and that the stocks have a lot of upside from sentiment simply getting less negative
  • As earnings bottom in 1H16, they expect investors will begin to look through the trough and focus more on the full-cycle upside evidenced by low price to tangible book value (TBV) and mid-cycle earnings multiples


Guggenheim thinks oil is a tightly coiled spring.Fundamentally speaking, the current combination of low oil prices, chronic under-investment, and low spare capacity, has set the stage for a return to a world in which price again becomes the arbiter of demand. Our oil market balances suggest that demand begins to outpace supply in 3rd quarter 2016.

JPMorgan believes that investors should begin rotating from consumer discretionary stocks into energy stocks. The firm predicts that the energy sector will be a market leader in 2016. A combination of falling non-OPEC production and increasing supply could trigger a technical rebound in oil prices in 2016 and they’ve named 15 companies as top stock picks in the energy space.

Right now with oil priced in the mid $30’s it’s hard to see the forest through the trees in the energy sector. But I’m pretty sure the world will still be consuming oil in the coming decades and that prices will be higher down the road. It’s always tough to see the bottom until after it’s been set in the investment markets, and I’m sure oil prices and energy stocks will be the same. I think we’re in the latter innings of this correction.

Posted on December 15, 2015 Read More

News Archive

Call Us: (775) 674-2222