Current State of the Energy Markets

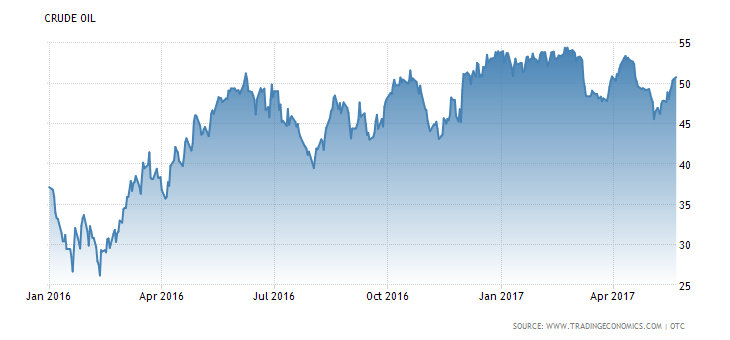
It’s been a fairly wild ride the last several years in the global energy markets. Oil prices crashed from over $100 per barrel to below $30 per barrel back in February of 2016, and have since stabilized in the $50 per barrel area today. See the chart below of WTI crude oil prices since the beginning of 2016:

What’s happened the last couple of years? Below is a quick summary of oil markets the last two years.

  • U.S. shale oil production increased dramatically over the last five years.
  • This, on top of increasing production in other global regions, led to an oversupply position in the global oil markets.
  • As the world produced more oil than it consumed on a daily basis, prices collapsed.
  • In reaction to precipitously falling prices, oil producers in the U.S. and globally curtailed production.
  • OPEC (led by Saudi Arabia) and non-OPEC (led by Russia) countries instituted oil production cuts.
  • Between curtailed U.S. production and the OPEC production cut the global supply/demand equation improved.

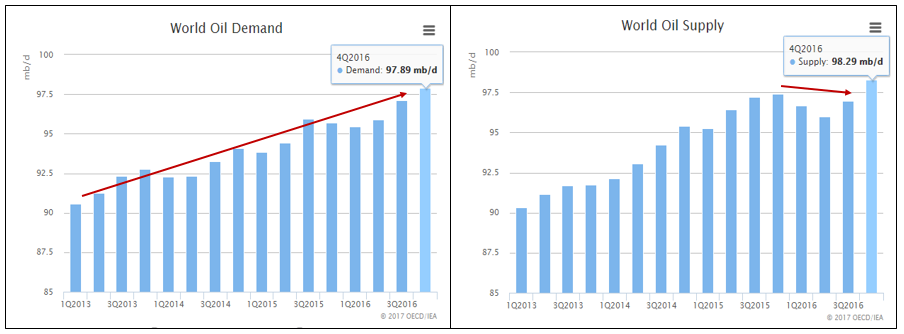
Looking at the charts below of global daily crude oil production and demand, we can see that things are fairly balanced right now after supply on the right-hand chart declined for several quarters:

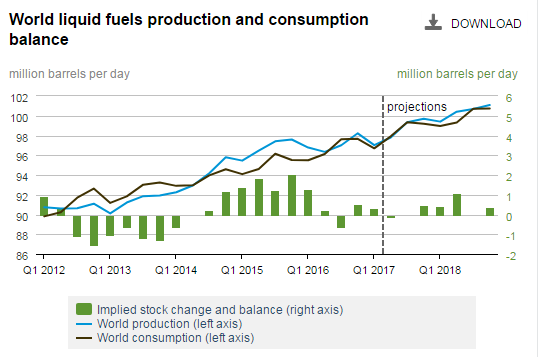
In fact, the U.S. Energy Information Administration (eia) forecasts that future oil market supply/demand conditions will remain balanced into 2018. See the chart below highlighting past and forecasted world production (blue line) and demand (brown line) by the (eia) below:

This balance should lead to more stable-to-rising oil prices going forward. Things to monitor going forward include:

  • the increasing level of U.S. production now that prices are stable (the U.S. is now a major swing producer in the global oil markets due to shale oil production)
  • the ability of OPEC and Russia to extend and honor their production cuts at the May 25th OPEC meeting
  • global economic growth and its effect on oil demand

Stable oil prices are generally a positive thing for the investment markets. We are forecasting WTI crude oil prices to finish close to $60 per barrel as we exit 2017. Oil prices at these levels will benefit:

  • the US economy in the form of energy sector jobs and capital investment
  • emerging market economies (many tend to be commodity based)
  • energy company earnings (about 15% of the stock market) which benefits the overall market
  • the high yield bond market and other energy related income producing securities

Overall, oil prices that are too low slow down our economy, just as prices that are too high can choke off economic growth. Prices in the $50 to $75 per barrel trading range will benefit the investment markets in our opinion. Prices in this range should benefit Gradient’s Energy Sector Focus portfolio as well as our more broad emerging market and energy sector holdings in the Gradient Tactical Rotation, Absolute Yield and Endowment portfolios.

To expand on these Market Reflections or to discuss any of our investment portfolios, please do not hesitate to reach out to us at 775-674-2222

Posted on May 24, 2017 Read More

The Re-emergence of the “FANG” stocks

So far, 2017 S&P 500 performance has been relatively strong. Through April, the S&P 500 returned 7.16%. An interesting dynamic of this performance has been the re-emergence of Facebook (FB), Amazon (AMZN), Netflix (NFLX), and Alphabet (GOOGL), or taken as an acronym, the “FANG” stocks. This market reflection will concentrate on the performance of the “FANGs” and other stocks that have driven market performance this year, and what that means for GI portfolios.

For a bit of history, the “FANG” acronym began to catch on in 2015. The FANGs were singled out as a result of:

  • the growth-oriented nature of these companies
  • their significant outperformance compared to the market

The chart below illustrates the “FANG” stocks significant outperformance versus the S&P 500 during 2015 (green), their underperformance in 2016 (blue) and their re-emergence in 2017 (yellow):

As a result of their size, the “FANG” stocks can have a large effect on the performance of the S&P 500. This is because the S&P 500 is a market-capitalization weighted index, which simply means that larger companies carry more weight and have a more significant effect on the performance of that index. In aggregate, the “FANG” stocks represent over $1.6 trillion in total market-capitalization. As an example, if the S&P 500 were an equally weighted index, the “FANG” stocks would be 0.8% of the total weight of the index (4/500 = 0.8%). However, because the S&P 500 is a market-capitalization weighted index, the “FANG” stocks represent a combined 6.5% of the total weight of the S&P 500.

In addition to the “FANG” stocks, there are other large cap stocks that have had a significant effect on year to date market performance. The data below shows the top 15 contributors to the S&P 500 performance year to date. The performance contribution from the top 15 stocks has been 3.36% in total, which represents 47% of the 7.16% year to date performance of the S&P 500.

How do the FANG stocks differ from Gradient 50 (G50) positions? The answer is DIVIDENDS. The G50 would not be invested in “FANG” stocks, as none of those companies pay dividends. As a reminder, the G50 portfolio invests in high-quality, blue chip companies that pay attractive dividends.

From the list above, only 5 stocks meet the G50 investment criteria of a high quality company with a superior dividend yield (highlighted in green). The G50 currently owns 3 of those 5 (in bold). Apple (AAPL) was also owned in the G50, but was sold in late January as the stock’s dividend yield fell below our hurdles. Therefore, in times when non-dividend paying stocks are driving the performance of the S&P 500, we understand that G50 performance may differ from the overall market.

Our team believes in the long term value that the G50 and high-quality, dividend paying stocks provide for growth and income investors. We have a strict investment process when selecting investments in the G50. While we certainly don’t discount the merit of owning growth companies like the “FANG” stocks for certain investors, we believe that these investments are suitable for a different type of portfolio, such as our growth oriented Gradient 33 (G33).

For the G50, as with all GI portfolios, we believe that adhering to our specified investment process is the best way to create a portfolio strategy that balances individual investor risk and return objectives.

To expand on these Market Reflections or to discuss any of our investment portfolios, please do not hesitate to reach out to us at 775-674-2222

Posted on May 11, 2017 Read More

Gradient in the News – Potential Stock Plays Ahead of Major Earnings Reports

Posted on May 8, 2017 Read More

News Archive

Call Us: (775) 674-2222