It’s hard to believe we’re already 6 weeks into 2015. It seems like the holidays were just a few days ago, but in reality we’re well into the year. Several themes have emerged and I think it’s worthwhile to review these:
This year our forecast is for a relatively flat U.S. stock market, let’s say a band of 0-5% for the S&P 500. Even though markets are hitting new highs, we’re still in this range, see the chart below of the S&P 500 year to date:
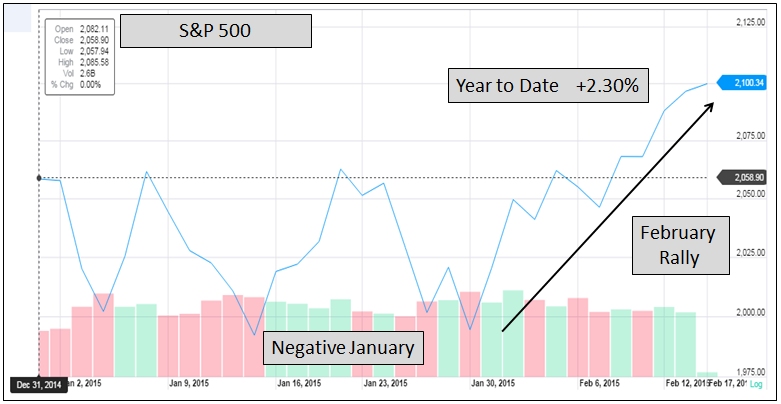
January started out choppy for stocks but a nice rally in February has left us in positive territory. Several items helped spur the rally, they are:
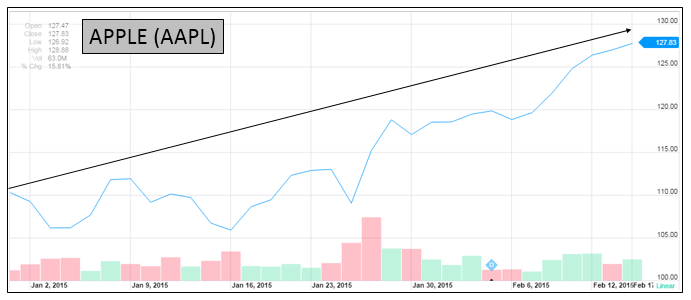
First, Apple’s stock (the biggest component of most major stock market indices) has been running. The G33 has owned a position in Apple since the inception of the portfolio and they reported very good earnings for the 4th Q of 2014. See the Apple (AAPL) chart below, it’s up 15% this year:
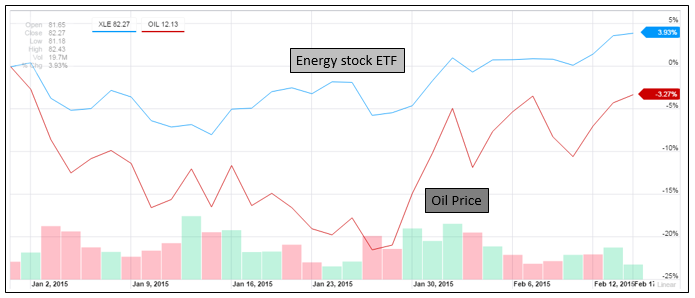
Second, the price of oil has stabilized, helping energy sector stocks recover. We still believe it’s premature to call a bottom in the price of oil and/or energy stocks. The chart below illustrates the price of oil (red line) and the XLE, energy stock ETF (blue line) year to date:
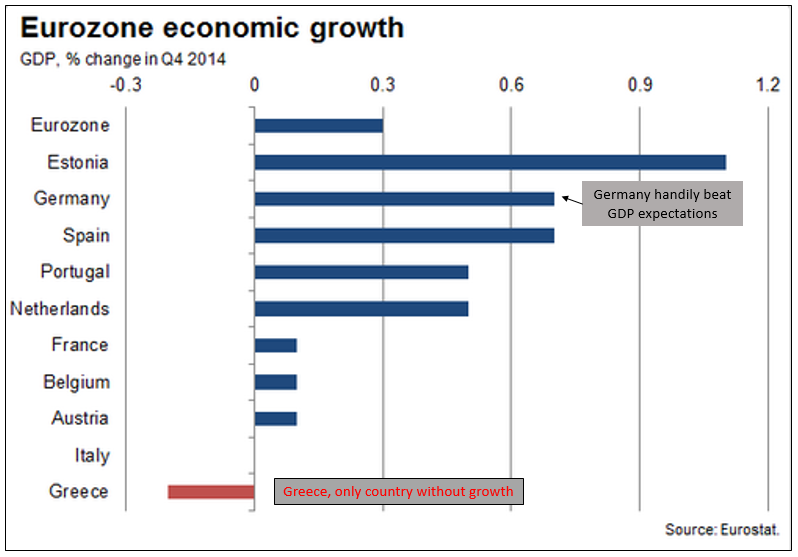
Third, optimism is creeping back into the European economy amid signs of a modest recovery taking place due to the QE (bond buying) program recently launched by the European Central Bank (ECB). This is good because Europe is the second largest economy in the world and is a big market for many U.S. based multinational corporations. Look at the chart below, all the countries in the Eurozone are showing GDP growth except Greece:
We still believe the International markets will provide opportunity for investors this year and next. The ETF Endowment Portfolios and the Gradient Tactical Rotation Strategy (GTR) provide exposure to this theme.
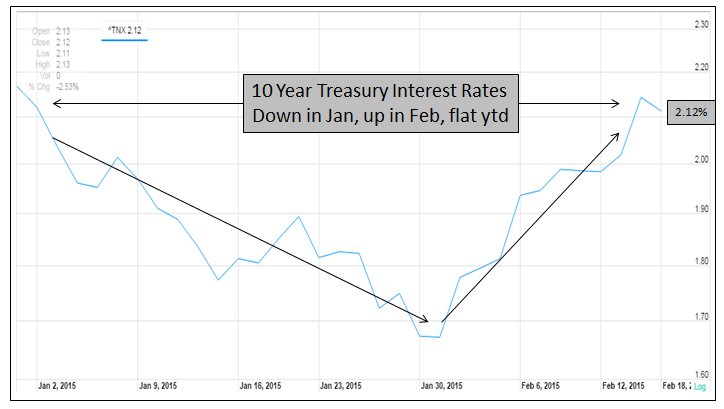
Finally, interest rates have remained low this year despite fears that the end of the Federal Reserve Bank’s QE program could drive interest rates higher. This helps the relative attractiveness of stocks versus bonds. The 10 year Treasury yield nosedived in January, rose in February and has remained relatively flat year to date. We forecast 10 year Treasury yields to remain range bound between 2.00 and 2.50% for the year. See the chart below:
Closing this week I’d like to highlight a chart that shows the real power of owning blue chip stocks, collecting dividends, and holding for years. The best performing stock since 1968 is probably not what you’d think. One dollar invested in this company in 1968 was worth $6,638 yesterday (including dividends). That’s an annual return of 20.6% for nearly half a century. The same dollar invested in the S&P 500 would be worth $87, or 98% less. See the chart of this stock below:
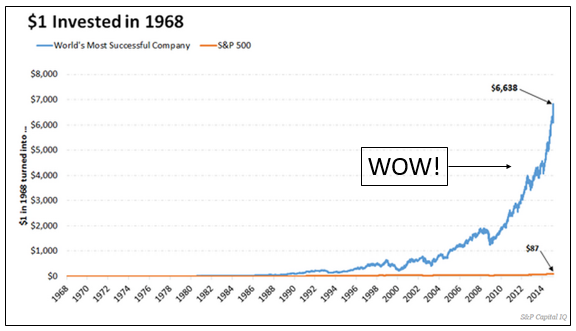
The company (and stock) is Altria/Phillip Morris, the tobacco company. The G50 has owned this stock since I’ve been at Gradient Investments. They’ve been able to raise prices, pay (and grow) a dividend, and expand internationally for decades. A boring business, not a lot of innovation, but great for shareholders. Too bad I didn’t put a few bucks myself into the stock back in the 60’s.
As of February 17th, 2015:
Dow Jones US Moderately Conservative Index is up 1.44% (TR) for the year
S&P 500 closed at 2,100.34 (TR) up 2.30% for the year
U.S. 10 year Treasury Futures are yielding 2.13% down 0.04% for the year
WTI Crude Oil futures closed at $53.50 down $0.21 for the year
Gold closed at $1,207 per ounce up $52 for the year
To expand on these market reflections or discuss other portfolio strategies please don’t hesitate to reach out to the Nevada Retirement Planners team.