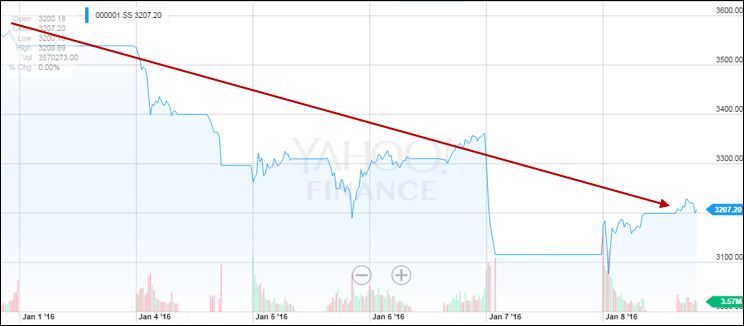
Stock markets around the globe fell in the first few days of the new year, for the worst opening week ever. It started in the mainland Chinese stock markets and dragged down Europe and the US also. In the process, the S&P retraced all of its gains since the end of September. What was the cause for of all this?
· Before the start of Monday’s trading a major indicator of Chinese economic growth, their manufacturing purchasing managers’ index, was reported below expectations and at the lowest level in three months.
· Retail investors in China rushed to sell stocks, also in anticipation of the lifting of a ban on sales by major shareholders at the end of this week. Note that their market is highly volatile and dominated by a small group of local individuals, not professional traders.
· New rules governing the closure of markets in the face of increased volatility further drove markets down.
· The Chinese central bank cut interest rates in each day for eight days to stimulate borrowing, help drive economic growth, and stem the market decline.
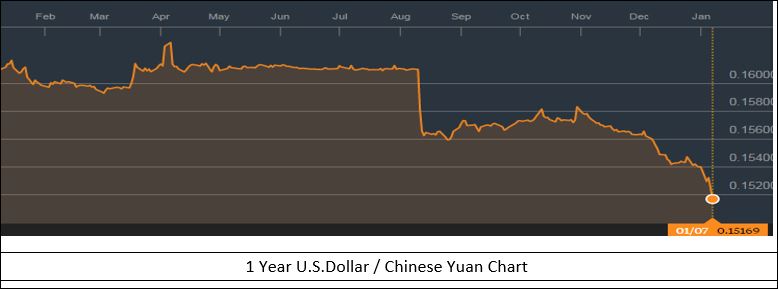
· All of these factors drove the value of the Chinese currency down.
· After four days, the Chinese stock index was down 21% from year end (see the chart below).

China appears to have been growing its economy in the 7-9% range for each of the last few years, well ahead of the vast majority of other countries. We think this has been moving, gradually, toward a 5-6% growth range over the next few years. This would be still positive and well ahead of other major countries. So a slowing in Chinese economic growth should not be a surprise.
On the news, stocks sold off. The Chinese government worsened the sell-off with their new “circuit breakers” or the automated closing of stock markets triggered by a 7% change in stock values. In general, circuit breakers are designed to stabilize the markets by allowing for a cooling off period for frantic stock holders. The Chinese closed their markets twice on Monday and again early Wednesday, obviously not having their desired effect. We are now hearing reports that they have suspended circuit breakers indefinitely.
With anxiety over slowing growth and increasing financial controls, the Chinese people are attempting to move their money out of the country. As the money flows out, their currency (the yuan) comes under pressure. Government actions last August and again in December were insufficient to support the yuan, so deflation becomes more likely. This also spooked the markets, and drove the value of the yuan to fresh five year lows. See the chart below.

We believe the devaluation of the yuan will likely drive additional capital outflows in the coming weeks. As capital flees China where does the money go?
Over the last few years we’ve seen it go into real estate in Canada, the US and other parts of the world. For those seeking more easily traded or “liquid” assets, US Treasuries are looking safe and attractive with roughly 2% yields. This compares to German bonds which yield about 0.50% and some other European government bond yields with negative yields. US dividend paying stocks are also looking attractive with an average 2% yield on the S&P 500.
The concept of slowing Chinese growth is highly emotional and, in terms of impact on US companies, we believe it is somewhat isolated. US exports to China represent less than 1% of our economic output, while American multinational companies generate only 2% of their profits from China. But as a competitor, cheaper goods from China could prove to slow sales of US based companies to the rest of the world and push down prices.
Of course China being China, their government also came in on the fifth trading day of the year to buy shares, providing support to the stock markets. European stocks finished the week down 6.5%, and the broad US market closed down 6%.
We believe US markets remain attractive with S&P companies trading at a slight 10% premium to their ten year average forward price/earnings multiple, with 8-10% earnings growth estimated over the coming year.
