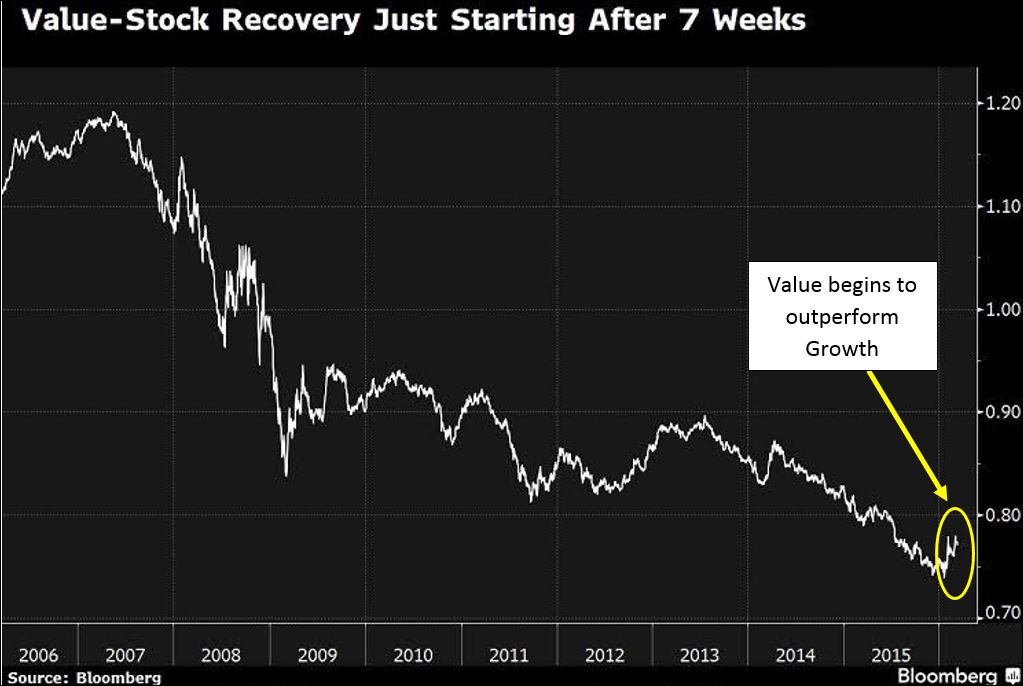
Growth stocks out-performed the overall market for the two years ending December, 2015. During that time growth stocks rose more than 15% while the S&P 500 rose by nearly 12%. Value stocks during the same time rose just about 8%. But conditions have begun to change.
We all understand what growth means, but just what do we mean by value stocks? They are those with the lowest valuations based on price to earnings (P/E), price to sales (P/S) and price to book value (P/BV). Over longer periods of time, many stocks move, or rotate, from growth to value and sometimes back again.
The dynamics that caused under-performance for value stocks for nearly two years have changed over the last two months. We can see this in the chart below where the line represents the ratio of the S&P 500 growth and value indices:
Why have value stocks, particularly larger value stocks, under-performed for the last two years? We’ve had a few key headwinds:
· Growth in Europe and the emerging markets was slowing, affecting sales for large multi-national companies.
· The rising value of the US dollar challenged overseas sales and earnings growth for most US-based multi-nationals.
· Commodity prices, including oil, fell for three consecutive years which affected sales and profits for companies that rely on commodities for revenue.
In 2016 we have begun to see these headwinds turn into tailwinds:
· Oil prices have recovered from $27 per barrel, a 13-year low, to over $40 per barrel. We believe prices have likely bottomed and that the price will rise to the $50-60 range in 2016. What will drive the decline is falling non-OPEC production and increasing overseas demand, driving down inventories below expectations.
· Steady, low interest rates from the Federal Reserve since December are causing the US dollar to weaken to $1.12 per Euro from a low of $1.05 over the last four months.
· In commodities, plans are now in place to reduce supply, driving most commodity prices higher as global economic demand appears to be improving. We can see this in prices for most major commodities and also for shipping costs on a wide variety of commodities, which are recovering from a 30-year low.*
Apart from valuation metrics, we’ve seen those large cap, value stocks with their strong dividend yields gaining appeal as bond yields remain lower for longer. For instance, a market basket of large cap value stocks yield 2.8%** versus just 1.9% for 10-year US Treasury bonds.
Meanwhile, many fast growth, high valuation stocks winners of last year are faltering. For example, Amazon (AMZN) trades at 122 times forward estimated earnings per share, two times sales and 20 times book value. It pays no dividend. Year to date the stock price is down about 17%.
The Gradient 50 is an equally-weighted portfolio of 50 blue chip, dividend paying stocks that have these desirable low valuation characteristics. The G50’s total return (price plus dividend income) is out-performing the broad US stock market by over five percentage points year to date. We believe it is well positioned to outperform for the rest of 2016 since these companies tend to be:
· larger market capitalizations with exposure to higher growth in global markets
· paying dividends that yield 3.7% on average
· priced at lower P/E, P/S and P/BV valuations than the market average
Markets usually extend a trend longer than investors anticipate. For now Nevada Retirement Planners would prefer income and growth oriented investors allocate new equity dollars into the G50 portfolio. We continue to believe that market fundamentals will drive stock prices. These fundamentals are determined by the health of the overall economy and the profitability of the companies that operate within the economy.
To expand on these Market Reflections or to discuss any of our investment portfolios, please do not hesitate to reach out to us at 775-674-2222
*Source: “Baltic Index Slips Further, Hits New Record Low,” Reuters 2/10/2016
** Source: Vanguard VTV ETF fact sheet

