We’ve long talked about the high correlation between stock prices and market fundamentals. The fundamentals are highlighted below:
- The health of the economy: it’s been growing at a moderate and stable pace
- Corporate earnings growth: they’re forecasted to grow 10% this year and in 2018
- Company and market valuations: they’re on the rich side, but not extreme
One metric that tends to go unnoticed is how the stock market also benefits from low interest rates. Lower interest rates generally make stocks look more attractive. The thesis is that if investors can’t earn a reasonable return in the fixed income markets they’ll look toward stocks to earn a higher, albeit more volatile return. Many Wall Street strategists are currently looking at the bond market as another avenue to judge the direction of the market. Two items that could give them concern are:
- A rising 10-Year Treasury yield
- An inverted yield curve (10-Year rates lower than 2-Year rates)
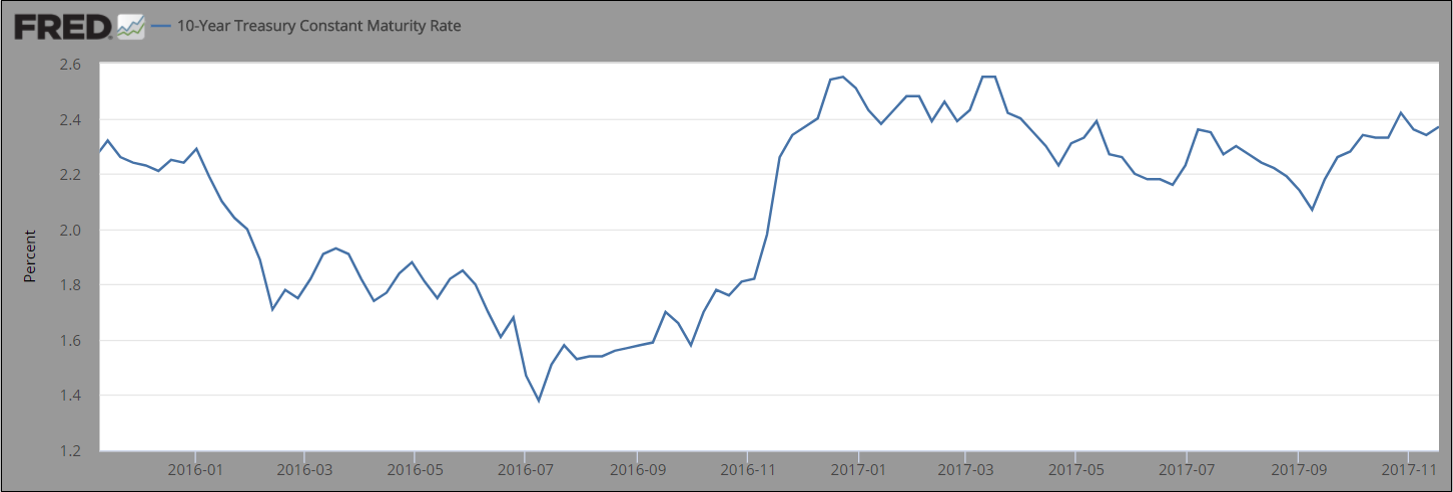
Interest rates have been low for a long time, and continue to be low. The Federal Reserve Bank (the Fed) has raised the “Fed Funds Rate” four times since December of 2015, after leaving it at zero for seven years. The 10-Year Treasury yield bottomed at 1.37% in July of 2016 and trades at 2.33% today. Longer term the 10-Year has averaged around 4.00%. If the 10-Year yield continues to rise between 3% and 4% levels, the returns of stocks and bonds will become more equalized and investors could be incented to rotate from stocks to bonds. The 10-Year Treasury yield is graphed below:
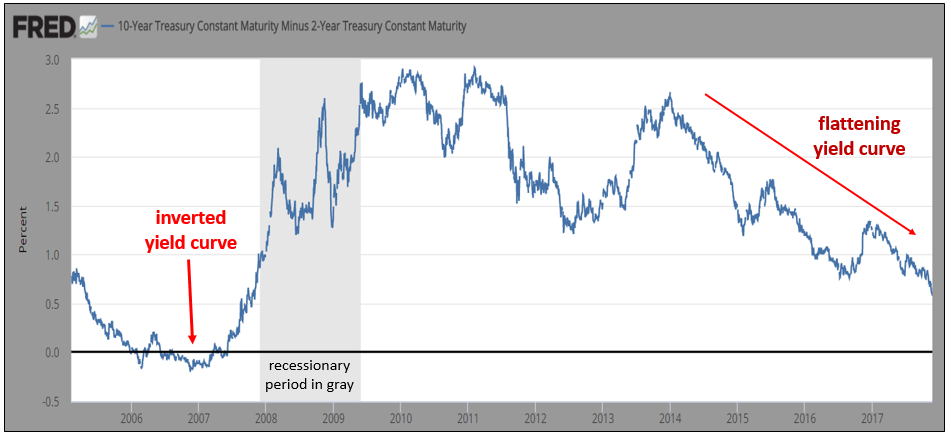
Another bond market chart that many strategists are watching is the spread between the 2-Year Treasury and the 10-Year Treasury. When the spread is positive we have a “normalized yield curve”. When the spread is negative we have an “inverted yield curve”. Recently the bond market’s yield curve is becoming flatter. This means longer term (10-Year) interest rates are slipping towards shorter term (2-Year) rates. The concern here is that a flat, or even an inverted, yield curve in the past has signaled a recession. The chart below highlights the spread between 10-Year and 2-Year yields; it’s still positive but becoming much flatter:
The US yield curve is now at its flattest point in roughly ten years. The gap between 2-year and 10-year yields has shrunk to just 0.58 percentage points, the lowest since 2007. In the past an inverted yield curve has been an indicator of an upcoming economic recession. We’re not inverted yet, but investors are closely watching this indicator as the gap shrinks.
Interest rates that are too high, or a yield curve that is too flat can cause concern amongst investors. We don’t believe 10-year interest rates are too high yet at 2.33%, but the flatter yield curve is something to watch as lower longer term interest rates tend to signal investor expectations for weaker economic growth and lower investment returns in the future. We are not there yet, but an inverted yield curve would certainly be a yellow flag for the investment markets and we’re watching this metric closely.
To expand on these Market Reflections or to discuss any of our investment portfolios, please do not hesitate to reach out to us at 775-674-2222.


