2017 will be a year that will likely be remembered for strong returns and an extraordinary lack of market volatility. Despite the day-to-day news flow on health care, tax reform, political uncertainty, and elevated market valuations, investors largely shrugged off these concerns and asset classes rose based upon supportive fundamental growth and strong corporate earnings. In the last market reflection of 2017, we will discuss what we believe were some of the most important stories of the year.
1) Asset class returns were strong
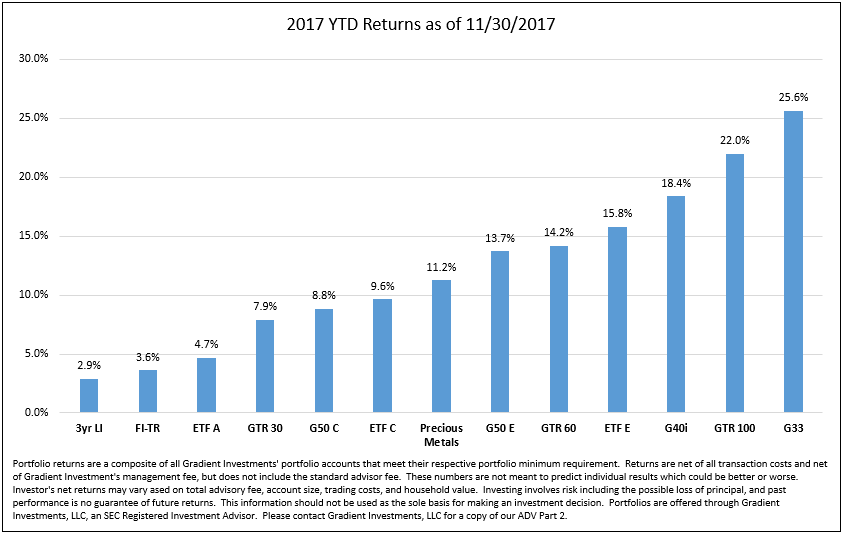
2017 performance has been mostly positive across asset classes. This performance was driven by several factors: GDP growth, both in the US and overseas, has been positive and accelerating. Jobs and wages have grown in the US throughout 2017. Federal Reserve rate hikes have been measured and well communicated in the US and monetary policy remains mostly stimulative outside the US. Global interest rates have remained relatively low and inflation has been controlled in most major markets. Tax reform that aims to significantly reduce the corporate tax rate has passed the House and Senate. Lastly, corporate earnings have grown at double digit rates in 2017 and expectations for continued growth have propelled markets across the globe. As a result, US stock markets were strong again in 2017 while international markets had a significant rebound after several years of underperformance. The below chart reflects performance of several of the Gradient investment portfolios across the risk spectrum. The data shows that investors had largely positive returns and were generally rewarded for taking risk in their investment allocations.
2) Volatility was historically low
By several different measurements, 2017 markets have had strong returns with extremely low volatility. Credit spreads, the premium paid to take on risk in bond markets, are near 10 year lows. The CBOE Volatility Index (VIX), a measurement of stock market volatility, is at levels that rank near the lowest in its history. Lastly, the below chart reflects annual returns (blue bar) and maximum drawdown (red dot) of the S&P 500. In 2017, the maximum intra-year decline has been 3%. This low level of decline is rare as it has only happened one other time in the past 25 years.
To expand on these Market Reflections or to discuss any of our investment portfolios, please do not hesitate to reach out to us at 775-674-2222.