At Gradient, we examine trends in both the stock and bond markets to get a better sense of investor sentiment regarding the future of the US economy. Three fixed income (bond) indicators that we watch closely are changes in the yield curve, potential inversions of the yield curve, and the level of credit spreads for investment grade and high yield bonds. Below we will provide a brief explanation of these indicators, why we feel they are important to examine, and what recent trends have occurred in each.
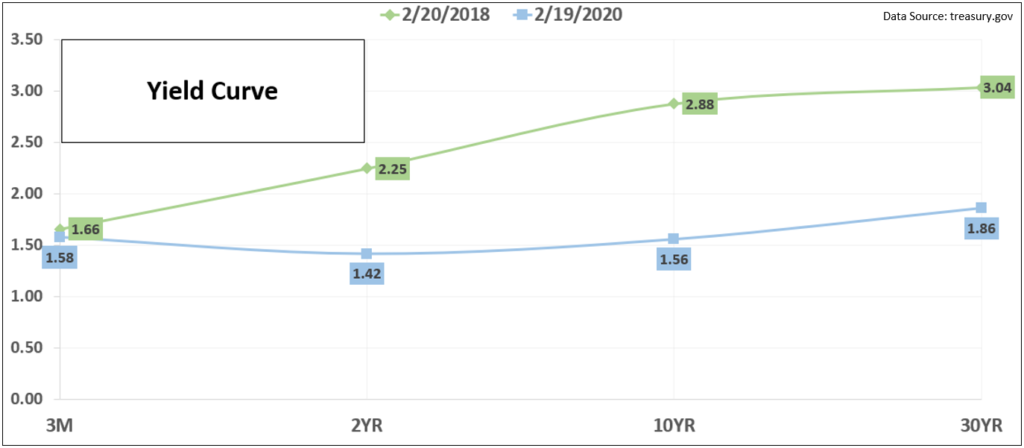
Yield Curve
The yield curve is a line that reflects interest rates at various maturities, and the most widely watched curve for US investors is the US Treasury yield curve. The chart below shows the treasury yield curve as it stands today versus 2 years ago. The blue line represents the current yield curve while the green line reflects the yield curve as of 2/20/2018. The current yields under all categories are lower than they were 2 years ago but have decreased more aggressively at longer maturities. As interest rates decline, existing bonds become more valuable, and this has been the primary cause of the bond market rally seen since 2019.
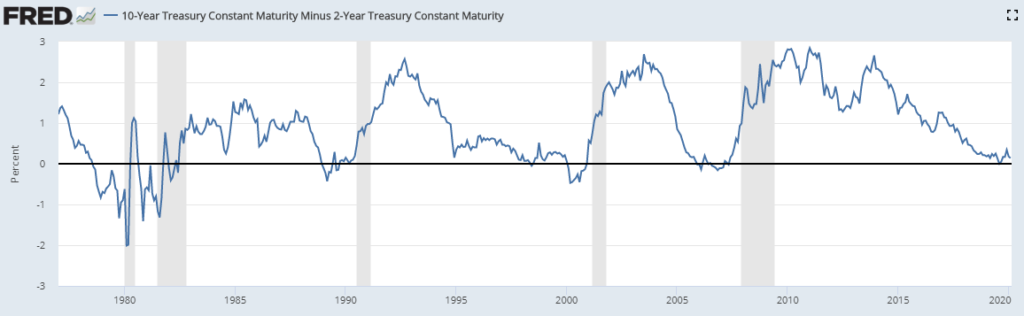
10-year versus 2-year spread
Another well-watched indicator is the spread between 2-year and 10-year treasuries, especially as we near an “inversion” (where 2-yr rates are higher than 10-yr rates). The reason investors have interest in this indicator is that an inversion has preceded every recession since 1950. The below chart shows the spread of the 10-year versus the 2-year since 1977 and the gray bars represent recessionary periods. We did experience an inversion briefly in 2019 and this has created some consternation regarding a potential upcoming recession. However, the magnitude and length of the inversion was relatively shallow compared to prior inversions that preceded a recession. Also, while an inversion has preceded prior recessions, it does not indicate that recessions are imminent in the near future.
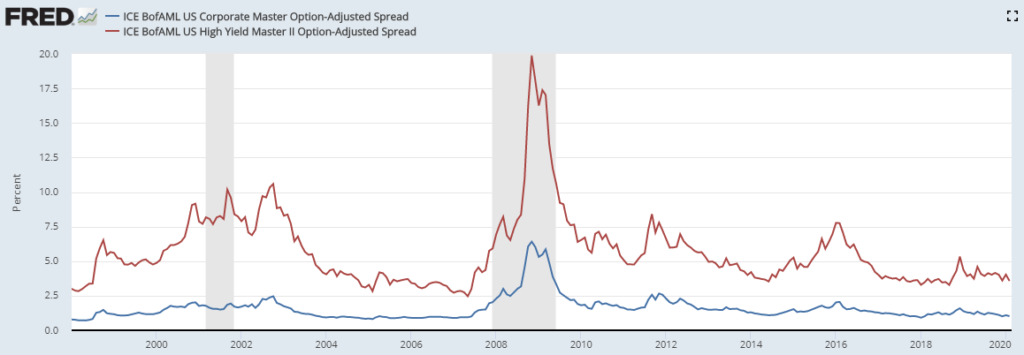
Corporate Bond Spreads
Corporate bond spreads represent the premium amount that investors receive for taking on the risk of a company potentially defaulting on their debt. Higher risk bonds from lower quality companies typically carry a higher premium to take on default risk. Below is a chart that shows the spread for both investment grade corporate bonds (blue line) as well as riskier high yield bonds (red line) since 1998. When investors are confident in economic conditions, spreads are relatively low. When we see economic recessions, where companies are facing a higher degree of uncertainty in their businesses, investors require a higher premium to take on the risk of default. Currently, we are near all-time lows in spreads for both investment grade and high yield bonds, suggesting that investors are less concerned about defaults in the near term.
While no single indicator can provide a crystal-clear picture of investor sentiment on economic conditions and outlook for the future, using these indicators together can provide some greater clarity on how bond market investors are positioning for the future. It is our opinion that investors do expect short term interest rates to stay stable or slightly decline, and that investors are not positioned for recessionary conditions. Our expectations are for lower returns in bonds compared to 2019 but also a “lower for longer” scenario where interest rates stay relatively range bound at current levels.
To expand on these Market Reflections or to discuss any of our investment portfolios, please do not hesitate to reach out to us at 775-674-2222.