The unemployment rate is a key economic indicator that provides insight into the health of the U.S. economy. Understanding the trends of unemployment, and what comprises the rate, is important to determining the general direction of economic growth.
The unemployment rate measures the percent of the labor force that:
- Does not currently have a job
- Is actively looking for work within the past four weeks
- Is available to work
The rate includes furloughed workers who are temporarily unemployed and waiting to be recalled to work from the employer.
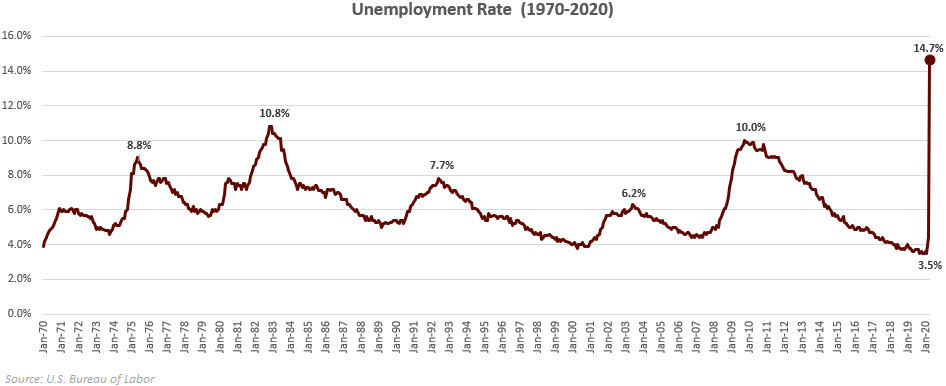
In April, the unemployment rate jumped to 14.7%, which is the highest number we’ve seen in recent history and is equivalent to one out of every seven working persons unemployed. To compare, here is the peak unemployment reached during prior times of crisis:
- Financial Crisis: 10.0%
- 1980 Energy Crisis: 10.8%
- 1973 Oil Crisis and Stock market Crash: 8.8%
- Great Depression: 24.9%1
Furthermore, the spike in unemployment has been much more rapid than in previous recessions. During the Financial Crisis in ’08-’09, the lowest unemployment rate was in March of 2007 at 4.4% and it wasn’t until 31 months later that we saw the peak of 10.0%; the current unemployment rate went from 3.5% to 14.7% within one month and can be seen in the chart below2.
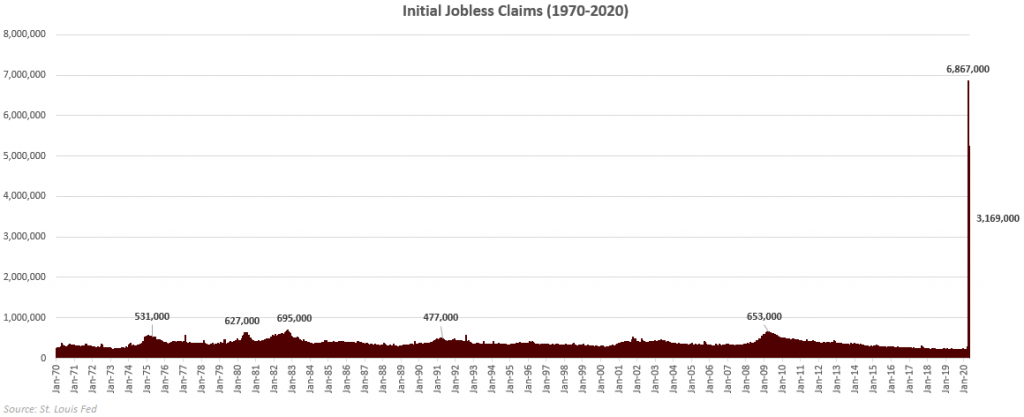
While the unemployment rate is an important indicator, it is also generally a lagging indicator of the economy. An early indicator that provides insight into trends for the unemployment rate is Initial Jobless Claims, which tracks the weekly number of claims for unemployment insurance. These claims do not include past weeks and are inclusive of the claims filed during that specific week. The chart3 below shows the spike in claims that began in the second week of March reaching an all time high of 6.8mln claims during the fourth week of March. Before the impact of the COVID-19 pandemic, the average weekly claims dating back to January of 1970 was 359,000 per week.
Using these two data sets together give us a picture of the health of the job market and a glimpse into the trends of the U.S. economy. No statistical number should be used in isolation, but the direction of employment is a critical element to U.S. consumer spending which drives our economy. It is also important to acknowledge trends in the market rather than the number itself – are they improving and better than expectations (good) or are they deteriorating and worse than expectations (bad). These trends are clearly negative right now and could worsen until social restrictions begin to lift and workers are able to find jobs. How fast these trends change will provide greater insight into how fast the economy is rebounding from this most recent crisis.
To expand on these Market Reflections or to discuss any of our investment portfolios, please do not hesitate to reach out to us at 775-674-2222.