2020 has been a year of dramatic swings in the US stock market, with a decline from all time highs on Feb 19, 2020 to down over 30% in just over a month and a 30% rally off the March bottom. Within this timeframe, there has been a large divergence in performance between stocks that have recovered and even exceeded prior highs while others are languishing and have not experienced the level of recovery seen in the broad market index (S&P 500). The segments of the market that reflect this is the divergence of growth versus value stocks.
Loosely defined, growth stocks tend to have higher revenue and sales growth and historically have had higher valuations and greater volatility. On the contrary, value stocks tend to have lower revenue and sales growth (more mature companies) but have historically held lower valuations (cheaper) and lower volatility. The S&P 500 is an index that has both growth and value stocks, and the index provider of the S&P (S&P Global) uses various metrics to dissect the 500 companies into value or growth segments. While not perfectly segmented, the S&P 500 is approximately 50% value and 50% growth.
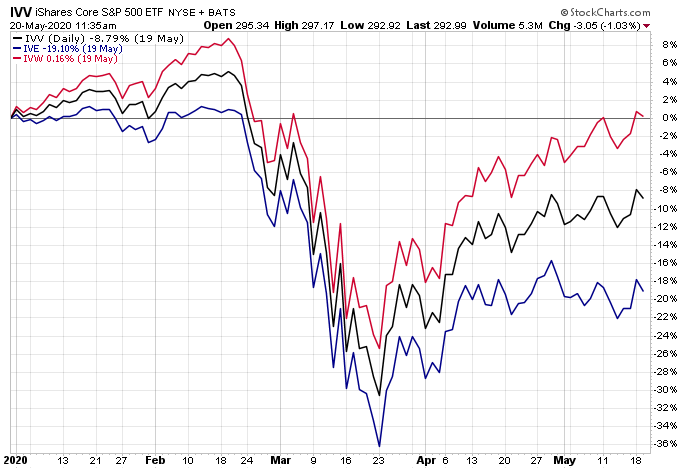
Using ETFs that represent the S&P 500 (IVV – black line), growth stocks (IVW – red line) and value stocks (IVE – blue line), the performance differential in 2020 (through 5/19/20) is quite dramatic.
- The S&P 500 is down 8.79%
- Growth stocks are now actually up on the year (up 0.16%)
- Value stocks are languishing (down 19.10%)
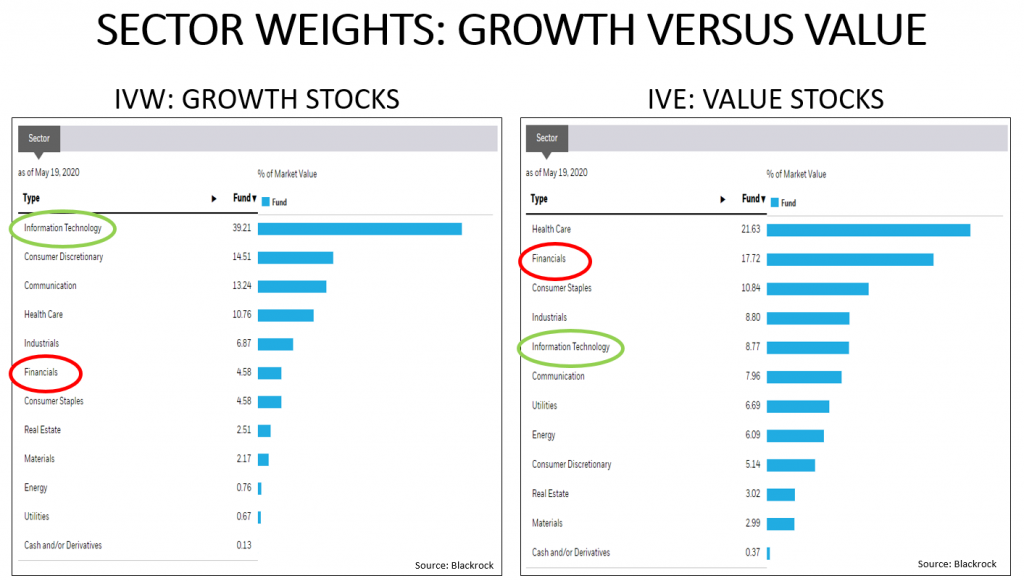
A significant factor for the level of outperformance in growth stocks over value has been sector composition. The data below shows the segmentation of IVW (growth stocks) on the left versus the IVE (value stocks) on the right.
- Technology stocks represent nearly 40% of growth compared to less than 10% of value
- Financials represent nearly 18% of value compared to less than 5% of growth
- Technology stocks (Apple, Microsoft, and Visa) have significantly outperformed Financials stocks (JP Morgan, Bank of America, and Wells Fargo)
- In Consumer Discretionary, Amazon (which has outperformed significantly) is a large percentage of the growth ETF (over 7%) while the value ETF has no position
Why is this important?
Within Gradient stock portfolios, the investable universe is dependent upon the stated objective. For example:
- The G50 is a blue-chip, US, dividend paying stock portfolio designed for growth and income.
- The investable universe for the G50 tends to be much more heavily weighted in value stocks, as those stocks have historically been the companies that pay higher dividends.
- On the contrary, the G33 portfolio is a diversified growth portfolio designed for long term price appreciation.
- It isn’t concerned with dividends and is going to invest in growth companies (like Amazon and Google) and will not be invested in value stocks.
The performance between the two portfolios reflects this difference in objective, as the G33 portfolio has had much greater performance in 2020 compared to the G50.
As these differentials of performance tend to normalize over time, but are difficult to predict, our preferred approach for investors is to have a blend of both and to periodically rebalance based on opportunity and risk. There are several ways to accomplish this, which include:
- A mix of the G50 for value and the G33 for growth (rebalanced periodically)
- An allocation to our Core Select portfolio – which invests in both growth and value segments
- An allocation to our Tilt Series – which is actively managed and includes G50, G33, and Core Select allocations in a mix determined by the Gradient Investment Committee
To expand on these Market Reflections or to discuss any of our investment portfolios, please do not hesitate to reach out to us at 775-674-2222.