The Continued Rise of E-Commerce

One of the long term secular themes in the market over the past 10 years has been the steady rise of E-Commerce as part of US consumer spending habits. The below chart shows the consistent increase in market share of E-Commerce as a percent of total retail share.
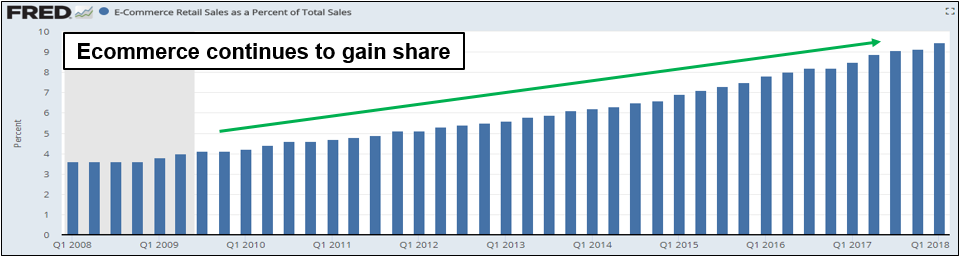
E-Commerce share has risen from just under 4% of total sales in 2008 to over 9% in Q1 2018. Considering total retail sales was $5.2 Trillion over the last 12 months, this growth of market share in E-Commerce represents a very large dollar figure.

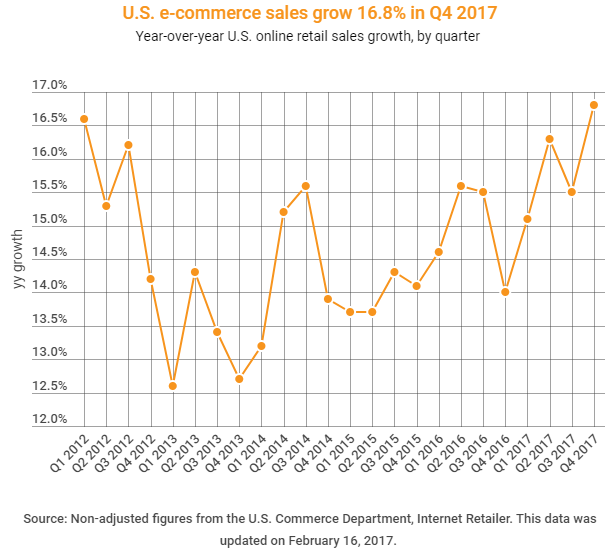
Also, the below chart reflects the growth of E-Commerce from Q1 2012 through Q4 2017. The yellow line shows that E-Commerce sales have grown between 12% and 17%, which is significantly faster than the 1-7% range of growth for total sales during the same period. The data clearly reflects the consumer preference to spend more of their discretionary dollars online.
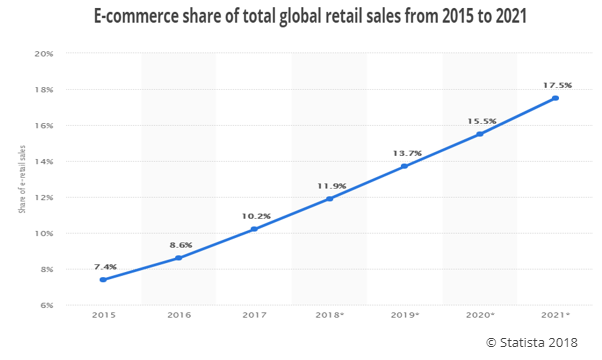
Finally, the chart below indicates the estimated market share growth of E-Commerce to total retail sales out to 2021. It reflects that the share gain of E-Commerce is likely to continue as new firms enter the market, existing firms transition more business to their online platforms, and existing players continue to grow faster than the overall market.
We have already witnessed some of the ramifications of this trend within several companies and industries. Whether that has been the significant rise of Amazon, the strategic changes and acquisitions going on at Wal-Mart, or the difficult market environment for several physical retailers in industries like retail apparel, electronics, and bookstores. Logistics providers, like UPS and FedEx, have had to adjust to increasing volumes but changing price dynamics and capital needs for their businesses. Pharmacy companies, like CVS and Walgreens, have had to face a more uncertain future as mail/online pharmacies create the opportunity for much greater competition. Even companies like REITs have to understand E-Commerce trends and how it affects their existing and future clients and their changing real estate needs.

By all indications, E-Commerce is a trend that is here to stay. How companies provide value through multiple channels will be a significant indicator of their future potential and growth opportunities. Selecting investments, especially within those sectors affected by E-Commerce trends, will rely on finding business models that can survive and thrive as a result of the changing landscape.

To expand on these Market Reflections or to discuss any of our investment portfolios, please do not hesitate to reach out to us at 775-674-2222.

Posted on August 1, 2018 Read More

Second Quarter Market Review

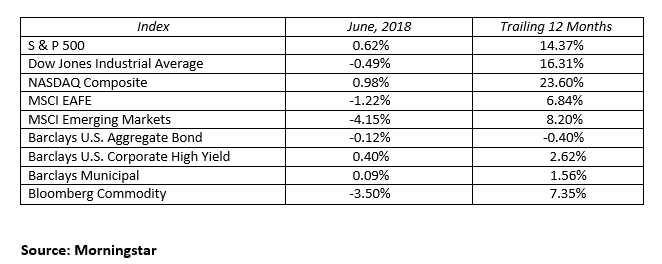
Headlines in the second quarter kept market volatility elevated. The market moving headlines covered a wide range of economic and political topics. First quarter corporate earnings reported this quarter were outstanding. The Federal Reserve raised short-term interest rates by 0.25% as expected and projected two more rate hikes this year. The contentious G-7 meeting put trade and tariff disputes back in the limelight. China retaliated in response to the U.S. tariffs, and Trump threatened to double down on China. The North Korean summit calmed fears of a potential nuclear showdown. The court decision on the AT&T/Time Warner merger came down clearing the way for a takeover without conditions. Unemployment rates hit historic lows as the economy continued to move upward.

The third quarter will have its own version of breaking news which the market will need to sort out. Obviously second quarter corporate earnings growth will be closely watched, tariffs will be monitored and the mid-term elections will begin to take center stage. News happens, but markets generally move according to fundamental factors of earnings, valuation and economic activity. It’s from these fronts that our market optimism lives. Consumers with jobs and confidence are a powerful economic force. Couple this with lower taxes, less government regulation, strong corporate profits and low interest rates and you have a recipe for future prosperity.

After a tenuous first quarter, the global stock markets produced mixed results. On the winning side: U.S. stocks proved superior to international stocks and emerging markets, small and mid-sized U.S. companies outpaced large capitalization multinational companies, and growth companies outperformed value. After nine consecutive positive return quarters, the Dow Jones Industrial Average posted a negative return in the first quarter, but began a new winning streak in quarter two. An eight day losing streak near the end of the quarter downsized the results in the second quarter, but the index stilled managed a 1.26% gain. In addition to the Dow, the NASDAQ Composite gained 6.61% and the S&P 500 increased 3.71% this quarter. International stocks did not fare as well with potential tariffs looming. The two major international indices (MSCI Emerging Markets and MSCI EAFE) were down 7.96% and 1.24%, respectively, for the quarter.

In the bond market, prices rallied after the benchmark 10-Year U.S. Treasury bounced off a 3.11% high yield and returned to its comfort zone in the high two percent range, but still left interest rates higher for the quarter. The benchmark 10-Year U.S. Treasury yield moved up 11 basis points to yield 2.85%. The yield curve continued to flatten. The 2-Year Treasury rose by 25 basis points to end the quarter yielding 2.52%, and the 30-Year Treasury rose just one basis point to 2.98%. Owning bonds in your portfolio will not hurt you, nor will they help your assets grow. Their value will either be an insurance policy against a stock market correction or a source of liquidity and price stability.

Unfortunately, long-term investing does not result in values moving in a straight line higher. The market and portfolios go through periods of varying performance. The best defense against market volatility is proper diversification. Structure your portfolio for multiple objectives (growth, income and principal preservation) in allocated amounts that align with your risk tolerance and long-term financial goals. The right asset allocation allows your portfolio to weather all environments and will keep you invested for the long haul.

MARKETS BY THE NUMBERS:

To expand on these Market Commentaries or to discuss any of our investment portfolios, please do not hesitate to reach out to us at 775-674-2222

Posted on July 11, 2018 Read More

Assessing Performance

When discussing investments, a common and important question to ask is “How am I doing?” When investors examine returns, they are usually looking at a percentage return over a specified time frame. Understanding what that number means for them, however, can be a challenge. To give context to their returns, investors may turn to benchmarks or indices (like the S&P 500) to assess their performance relative to something else. While this can be an understandable approach, it can be misleading in certain circumstances and potentially risky if it leads to bad decision making.

As an example, consider the following two investors:

In the above example, how is Investor A doing? Investor B? The answer, as in many things, is “it depends”. For example, what if Investor A was fully invested in stocks when stocks were up 30% during the same period. Secondarily, what if Investor B was fully invested in bonds when the average bond performance was negative. Does that change the answer?

To add another layer, what if Investor A (100% stocks) is 80 years old and required consistent income and portfolio distributions to meet their expense needs. For Investor B (100% bonds), what if they are 25 years old, have a high tolerance for risk, and will not need distributions from these assets for another 40 years. Does it change the answer again?

The point of this exercise is not to further confuse the situation. It is simply meant to show that performance is relative, not only to benchmarks, but to each individual client financial objectives. An 80 year old investor who is reliant on portfolio distributions to meet their expense needs is significantly different from a 25 year old investor whose primary goal is to grow their assets. Therefore, their portfolio needs, and their overall performance, should also be judged very differently.

How investors determine their performance should be relative to their personal situation. Performance should be discussed in context of their investment plan, based on risk tolerance, time horizon, and income needs. Once an investor’s financial plan is built, there should be a clear understanding of what assets are in the portfolio and their primary objective. A simplified examination could look like this:

  • Cash: The purpose is for asset preservation and liquidity
  • Bonds: The purpose is for income generation and risk reduction
  • Stocks: The purpose is for long term growth, or a hybrid of growth and income, with increased risk

Without this understanding, investors looking to assess “how they are doing” may be misled by using one benchmark that doesn’t consider the client’s individual situation and objectives. Further, they may be led to action (“performance chasing” or “flight to safety”) that does not align with their long term objective and risk tolerance. Over time, this has the potential to detract from value.

To expand on these Market Reflections or to discuss any of our investment portfolios, please do not hesitate to reach out to us at 775-674-2222.

Posted on June 26, 2018 Read More