Q1 2017 Economic Review and Market Outlook
How Alarming is the U.S. Federal Debt?
Since the lows of 2009, the U.S. stock market (S&P 500) has tripled as the economy and corporate profits have recovered. The federal debt levels of the U.S. government have almost doubled in the same time period. Federal debt outstanding has moved from roughly $10 trillion at the depth of the financial crisis to almost $20 trillion today.
See the chart below illustrating the moves in both the stock market and the federal debt:
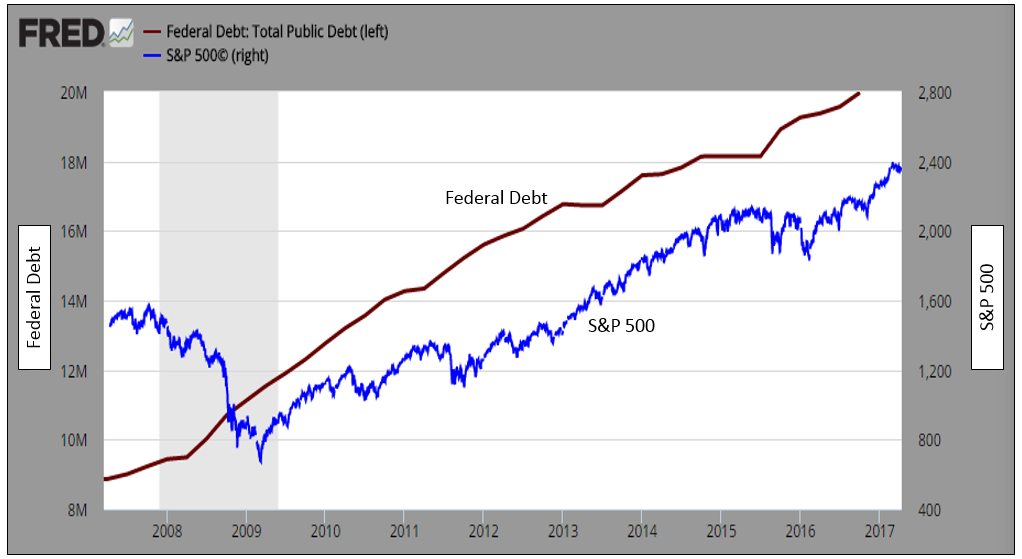
Federal debt increases are the subject of immense media sensationalism, political grandstanding, and investor anxiety. How did the debt increase so much? It’s largely in response to the imploding economy during the financial crisis of 2008-2009. Debt increases are a function of the government not being able to pay its bills. Too little revenue (taxes) compared to costs (spending) equals budget deficits. Ever since 2001 the federal government has been running annual deficits, in fact they rarely show a surplus. See the chart below illustrating annual surpluses and deficits:
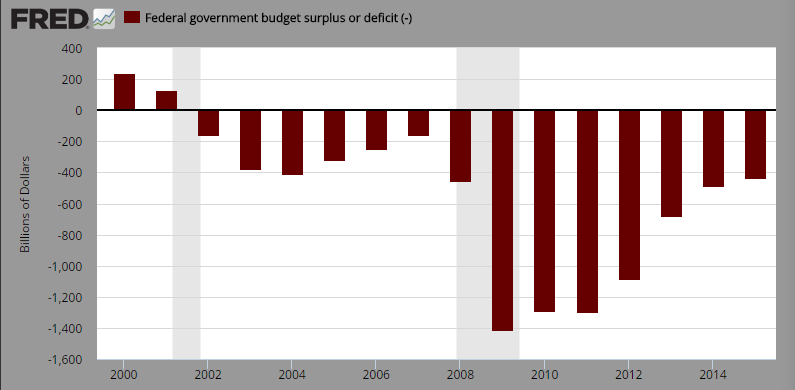
As an investor, should I be concerned about the ever increasing levels of debt at the federal level? The answer is really yes and no. We certainly don’t want to see federal debt doubling every 8 years, but I would focus less on the actual debt number and more on the our government’s ability to service (pay the interest) on its debt. When we look at our ability to service the debt, a less alarming picture presents itself. There are a couple of things to take into consideration when discussing debt service.
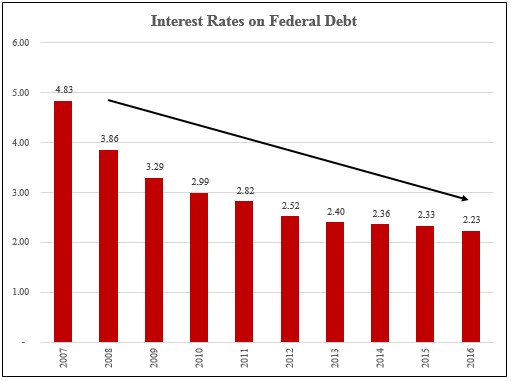
First, what is the interest rate our government is paying on its outstanding debt? Before the financial crisis, rates on federal debt was close to 5%. Today it’s down, closer to 2%. When rates are lower, the government can carry more debt and keep debt servicing amounts level. See the chart below:
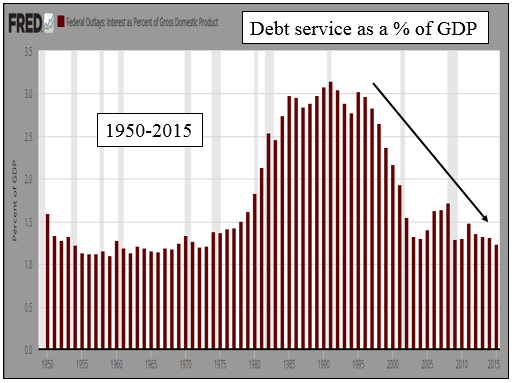
Secondly, I think it’s worthwhile to look at government debt interest payments as a percentage of our economy (GDP). Federal debt servicing costs as a percentage of GDP are at normalized historical levels. In fact, debt service was at much more alarming levels in the 1980’s and 1990’s when interest rates were much higher and defense spending was being ramped up, as seen in the chart below:
A few other things to consider on the topic:
- The entirety of the $20 trillion obligation never really comes due, it’s simply rolled over (much as corporate America does).
- If the global investing collective was concerned about the ability of the U.S. government to service its debt, I’d expect U.S. interest rates to skyrocket and the U.S. dollar to become very weak. Currently the exact opposite is occurring.
- Federal income tax revenue has also increased as our economy has grown over the years, offsetting increased debt obligations.
We know the media and politicians hype the absolute amount of Federal debt, but hopefully the last two charts on debt servicing levels puts your mind at ease on the matter. Remember, when we discuss federal debt we’re really talking about the full faith and credit of the U.S. government and its ability to pay and service its debt.
Currently investors and rating agencies around the world are comfortable with our ability to pay and service our federal debt. In fact, investors worldwide tend to feel U.S. government Treasury bills, notes, and bonds are a safe haven in the global fixed income marketplace.
To expand on these Market Reflections or to discuss any of our investment portfolios, please do not hesitate to reach out to us at 775-674-2222
First Quarter Review
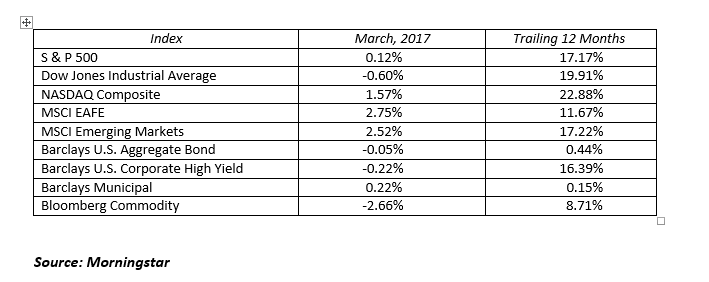
If you like action, the first quarter was fast and furious. The stock market continued to find new highs on a daily basis with the Dow Jones Industrial Average surpassing 20,000 for the first time. Before the market caught its breath, the 21,000 level was shattered in just 24 trading days. Some of the air was let out of the balloon in March as the Federal Reserve raised the federal funds rate by 25 basis points and healthcare reform died in Congress, clouding the picture for future tax cuts.
The U.S. stock market has responded positively to a pro-business agenda emanating from the new leadership in Washington. With the backdrop of a growing economy, full employment, expanding wages, low inflation and a confident consumer, the promise of less regulation and lower taxes has fueled this market. While this formula brought us here, the question becomes, “Can the concepts be converted into policies and reality?” Stay tuned.
Stock returns were positive around the globe last quarter with emerging markets and international developed leading the way. International markets are becoming more attractive after under-performing the U.S. over the last 1, 3, 5 and 10 year periods. A recent acceleration in overseas economic growth is becoming reflected in their stock prices. The U.S. market found leadership in our old FANG (Facebook, Amazon, Netflix and Google) names and added another A for good measure (Apple). This group of stocks had an average return nearing 20% in just the first quarter. Energy was the primary laggard as oil prices found their way to just below $50 per barrel, down from a high of $56 in mid-February.
This is an interesting time for the bond market. The Federal Reserve is on a long overdue mission to raise short-term interest rates and return to a normal monetary policy. This will likely be the first year in the past ten where the Fed raises rates on multiple occasions. In addition to two or three more rate hikes this year, the Fed also must reduce their balance sheet by selling trillions of bonds they purchased during the multiple quantitative easing programs. This process will take years to unwind. We expect that interest rates will move higher at a glacial pace with the Fed deliberate and the economy stable.
Bonds traded in a tight range for the quarter with the 10-year U.S. Treasury reaching a peak yield of 2.62% and bottoming out at 2.31%. It closed the quarter yielding 2.40%, five basis points lower than where it began the quarter. Credit spreads also tightened a bit providing an incremental lift to bond prices this quarter. Investment grade spreads were 5 basis point tighter and high yield rallied 29 basis points, helping this sector outperform. It’s okay to own bonds for the basic reasons of income, principal preservation or volatility control, but temper your expectations for this asset class as we move through the year.
It is important to remember that markets move higher over time, but they do not move higher all the time. The first quarter was a solid one despite a slight pullback in March. We believe the markets are fairly valued here, but not overvalued. Stocks moving 5% higher from here by year end and bonds earning the coupon are reasonable 2017 expectations. Like 2016, there will be some bumps in the road. An employed and confident consumer in a lower tax world will lead the way to moderately higher stock prices. Stay invested and use any pullbacks as a buying opportunity.