A Housing Market Update

Residential home construction and transaction activity are very important components of the US economy.  To gauge the health of the housing market, various sources provide data that give us a glimpse of construction activity, home sales, pricing trend analysis, and the direction of stock prices for companies reliant upon housing.

Housing Starts

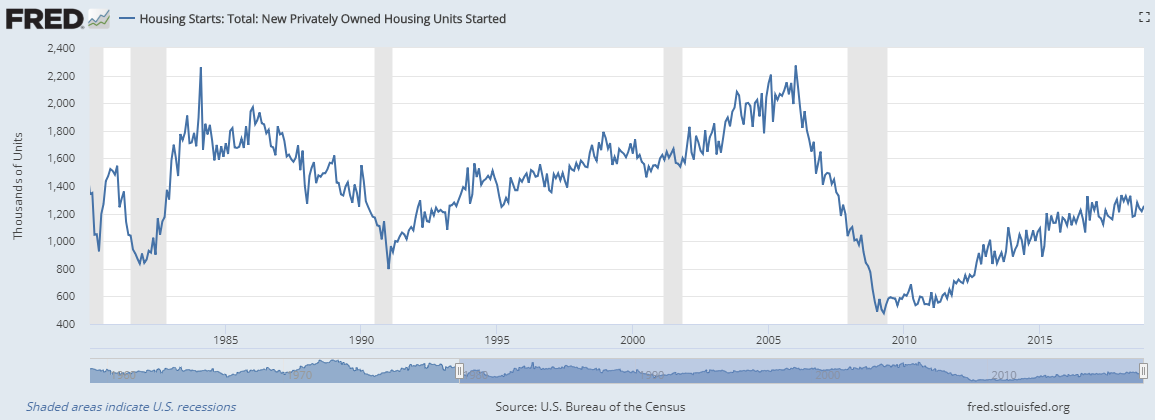
Housing start data is provided monthly by the US census bureau and reflect the number of home units that were started at the beginning of each month.  The chart below reflects the housing start data since 1980. Housing starts have largely been rising since hitting a bottom in April of 2009, but the pace of starts has been at much lower levels than prior expansion times in the 1980’s, 1990’s, and early 2000’s.   In fact, a recent Bloomberg article suggested that our current rate of starts is below the level of the 1960’s, when the US population was less than 60 percent of what it is today.*  The latest data has been delayed due to the government shutdown, but the last reported data reflected a slowing construction market as November 2018 starts were 3.6% below the level in the prior year.

Pending Home Sales Index

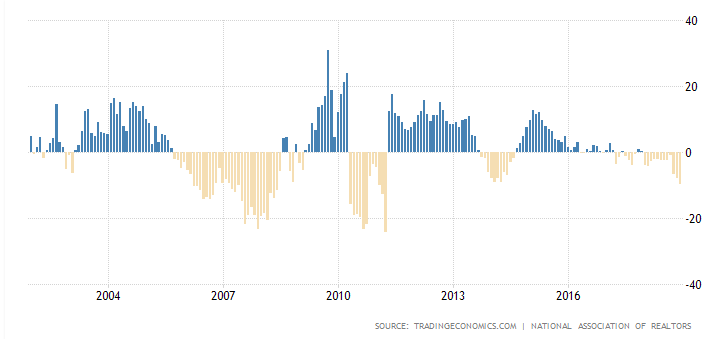
The National Association of Realtors provides a monthly index that measures signed contracts for home sales.  The chart below reflects the year-over-year growth rates of the pending home sales from 2002 to December 2018.  In the most recent month, sales declined, reflecting a slowing in transaction activity in the housing market.  According to CNBC, the pending home sales data from December 2018 marks 12 straight months of declines and the lowest December sales reading since 2013.**

United States Pending Home Sales – Year over Year Percent Change

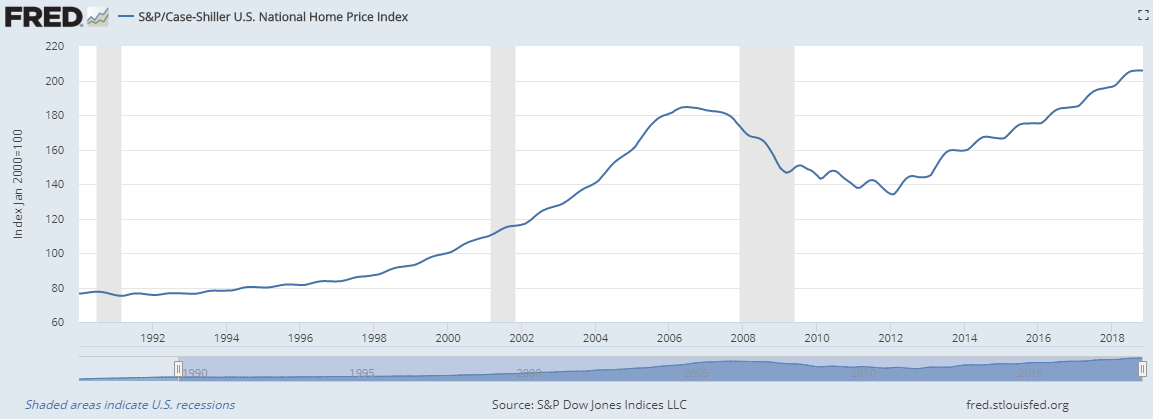
S&P CoreLogic Case-Shiller US National Home Price Index

S&P Dow Jones Indices provides monthly data that reflects national pricing trends for the residential real estate market.  The below chart shows data from 1990 to November 2018.  The information shows that prices have been steadily rising since bottoming in April 2012 but recent data (August to November 2018) shows more of a flattening pricing environment, where price increases slowed to 5.2% year over year.

Housing-related stocks

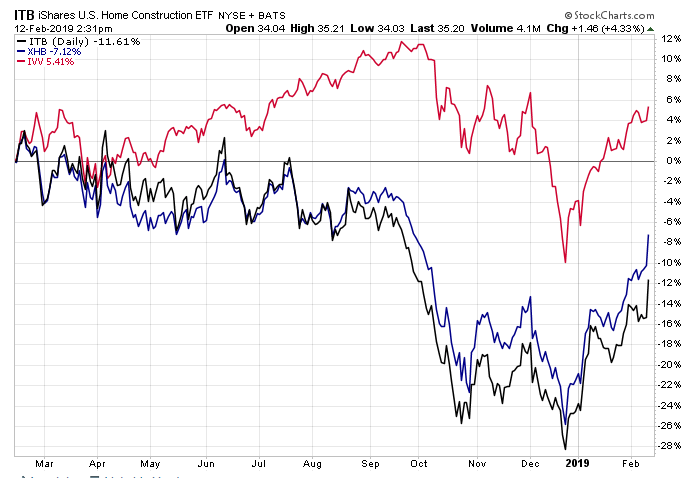
Another indicator of the housing market is the stock performance of companies that are tied to housing and home improvement.  Two exchange traded funds, iShares US Home Construction (ITB) and SPDR S&P Homebuilder (XHB), provide a broad look into the performance of housing related stocks.  The chart below reflects that housing stocks (ITB: Black line, XHB: Blue line) have generally underperformed the S&P 500 (IVV: Red line) over the last year.  However, year to date performance of the homebuilder stocks have rebounded to a greater degree than the overall market, suggesting sentiment is shifting toward more favorable housing conditions in the future.

As the data shows, the housing market was soft in 2018.  Transactions and housing builds were largely flat to down year over year, prices began to flatten, and housing related stocks underperformed the market.  As we begin 2019, there has been a sentiment shift in housing stocks.  For this trend to continue, the market will need to see stabilization and future growth of the data that measures housing related activity.

Bloomberg 2-11-19

**CNBC 1-30-19

To expand on these Market Reflections or to discuss any of our investment portfolios, please do not hesitate to reach out to us at 775-674-2222.

Posted on February 19, 2019 Read More

Back on Track

On the heels of a terrible month in the stock market, the market righted itself keeping the wounded bull alive.  The fourth quarter’s swift and painful stock correction proved an opportunity to buy stocks at clearance prices.  The New Year brought renewed hope as interest rates remained stable and stock prices began to rise from some oversold conditions.

The main catalysts for this much needed turnaround were:

  • A change of perspective at the Federal Reserve Bank. The comments coming from the Fed throughout the fourth quarter were very hawkish.  They were clearly on a mission to raise the fed funds rate with regularity and had the balance sheet reduction program (a.k.a. Quantitative Tightening QT) on auto pilot.  After the December rout, they lightened their language to a more dovish stance emphasizing patience and data monitoring. The market breathed a sigh of relief.
  • Corporate earnings season began.  The early read here has produced mixed results, but overall expectations are for 5-10% earnings growth this year.  This is good news for stock prices, especially in light of the lower valuations coming out of year end.
  • A glimmer of hope on China trade. The U.S. and China are having high level in-depth meetings leaving investors with the belief some trade resolution is possible. This is a complex multifaceted issue that will take years to completely resolve, but there are signs tariff escalations can be halted and some preliminary agreements reached.
  • The government is back in business (for now). The partial government shutdown was more of a political event and less of an economic event, but it does remove a barrier for now and possibly will lead to new headlines about things that matter. 

The January stock rally has been a traditional “risk on” trade as high beta and small capitalization stocks outperformed low volatility and large capitalization companies.  This stock market turnaround has been a complete reversal from what we saw during the fourth quarter correction.  Reported fourth quarter earnings and more importantly, 2019 earnings guidance, are behind many individual stock price movements. The market swiftly rewarded companies exceeding expectations (Apple, Boeing, IBM, Bank of America, and VF Corporation) and punished those falling short of expectations (Abbvie, Caterpillar, Bristol Meyers Squibb).  The NASDAQ Composite, S&P 500 and the Dow Jones Industrial Average gained 9.8%, 8.0%, and 7.3% respectively in January.  International stocks also had am impressive month as the MSCI EFAE and emerging markets indices produced gains of 6.6% and 8.8% in January.

The first Federal Open Market Committee meeting, held in late January, kept the fed funds rate unchanged as expected and the Fed reiterated their new found “wait and see” language.  The stock and bond market has embraced the new and improved patient Fed.  The benchmark 10-Year U.S. Treasury traded in a very tight range around a 2.72% yield, but rallied into month end after the FOMC meeting.  It closed the month yielding 2.63%, down 6 basis point since year end.  The yield curve retained its relatively flat, but still positively sloped shape. The 2-year Treasury fell by 3 basis points to end the month yielding 2.45%.  Meanwhile, the 30-Year Treasury also fell 3 basis points to yield 2.99%.  The yield curve shows a modest inversion at the 2-5 year segment of the curve, but for now, the overall curve remains positively sloped.

As we look ahead to the next eleven months of the year, here are the major themes we see playing out in the economy, stock market, and the bond market:

  • The U.S. economy continues to expand, but at a slower pace than 2018.
  • International economies display moderating, but still positive growth.
  • Corporate earnings continue to grow this year in the 5-10% range.
  • Interest rates remain relatively stable with the 10-year U.S. Treasury yield approaching 3%.
  • The Federal Reserve will slow their pace of rate hikes this year (one 25 basis point move higher in the second half of the year).
  • Stock market volatility remains elevated in 2019.
  • Expect stocks to return 4-6% and bonds 1-3% this year.

Remain patient with your investment portfolio.  Your patience will likely be tested a few times this year.  If your portfolio is properly balanced at the appropriate risk level, you will be much better equipped to deal with the market’s volatility and subsequent emotional challenges.  At the margin, investors can add some risk after a 10-15% correction and can reduce risk when the market revisits new all-time highs.  In lieu of a marginal trading strategy, just peg your risk tolerance level and stay fully invested throughout tomorrow’s highs and lows.  

MARKETS BY THE NUMBERS:

To expand on these Market Commentaries or to discuss any of our investment portfolios, please do not hesitate to reach out to us at 775-674-2222

Posted on February 4, 2019 Read More

2018: A Difficult Year For Markets

In 2018, most asset classes ended the year in negative territory.  US bonds finished the year just barely in positive territory (+0.01%), while all others listed below were negative.  Based on the below chart, a diversified portfolio consisting of the included 5 asset classes, would have been down over 7% in 2018.

Also, the chart below shows the return of volatility in stock markets in 2018.  2017 was an abnormal market in terms of lack of volatility, with 8 instances of greater than 1% daily moves (up or down) in the S&P 500.  In 2018, the number dramatically increased to 64 days.

As we look to 2019, we have begun the year with several uncertainties that could create further volatility.  These include:

  • A US government shutdown
  • Oil prices that have fallen aggressively
  • The threat of tariffs and continued trade tensions
  • The potential for slowing economies, both the US and abroad
  • The threat of slowing corporate earnings

While the reasons can be different, the fact is uncertainties are commonplace in the stock markets.  We will always have risk and be faced with unknowns that can swiftly change the course of the markets in the short term.  This is not new.  Because of this, timing the market is extraordinarily difficult and usually destroys value over time.

There are, however, actions that create value for investors over longer periods.  Those are:

  • Having an investment plan that considers your specific objectives, needs, and risk tolerance
  • Diversifying among assets, including both safe assets and higher growth / higher risk assets
  • Periodically rebalancing portfolios back to their proper asset allocation

Remember, diversification works over time, not all the time.  Being properly diversified means some assets will be outperforming your portfolio, while others will be underperforming.  However, the chart below reflects that asset leaders and laggards vary significantly from year to year, and significantly shifting assets toward what worked in the past is generally a losing proposition.

To expand on these Market Reflections or to discuss any of our investment portfolios, please do not hesitate to reach out to us at 775-674-2222.

Posted on January 16, 2019 Read More
Call Us: (775) 674-2222