Understanding Value vs. Growth & Recent Trends

Investors easily toss around the terms “value stocks” and “growth stocks”, but what do these labels actually mean?

Value investing refers to buying stocks that trade below the market averages and their own historical range as measured by price-to-book value, price-to-net asset value, price to earnings, or some other ratio integral to their business. Value investors tend to regard these calculations over market cycles, and make long term estimates of future growth, cash flows and earnings power. Different investors use different metrics, so there is also a second layer of value investing techniques: allowing a significant margin of error from the estimated intrinsic value. Value investors will buy stocks with the lowest current valuations and sell those with the highest current valuations, generally.

Put another way, value investors are buying a stock after others have lost confidence, when the stocks tend to carry lower risk than the market overall. These investors try to sell when the stock price has recovered and others have become euphoric about the stock’s prospects.

Growth stock investing, on the other hand, involves buying companies that have higher expected growth rates than the averages, with a strong cadence of sales growth and profitability. Companies are usually young, with a new technology or service that is expected to disrupt the status quo. These firms may not yet have earnings or generate positive cash flow. Cash is reinvested in people, equipment, facilities and/or research so the stocks provide no dividend yield.

Valuations such as price to earnings ratios are usually higher with growth stocks. Price/earnings-to-growth is an important measure since price to earnings alone does not easily compare with market averages.

Growth investors are searching for higher rewards, while taking on higher than average risks including but not limited to emerging competitive products/services, depth of management, decelerating revenue growth and/or accelerating costs or expenses. This higher risk is associated with better price performance when the general stock market is rising, and with underperformance when the general stock market is in decline.

At Gradient Investments we offer a U.S. value-oriented stock strategy, the G50. Over time it carries about 20 per cent less volatility than its benchmark, the S&P 500 index. We also offer the G33 stock portfolio which is U.S. moderate growth oriented and carries about 25 per cent more volatility than the U.S. stock market over time. The growth and value styles rarely perform in line at the same time, but overtime perform roughly the same. Therefore, investors in the G50 or the G33 should not expect them to outperform the U.S. market every year. We also offer an international value-oriented stock strategy, the G40i. Look at the images below to see how the U.S. and international value segments have performed over time.

U.S. Value and Growth Rarely Perform In Line
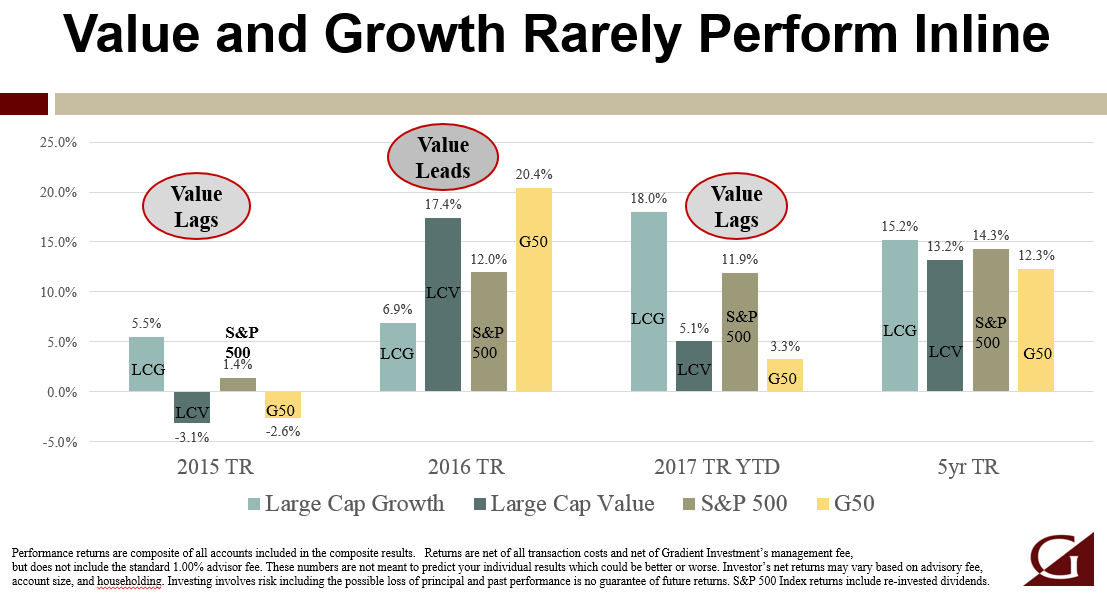
· In 2016 U.S. Large Cap Value (LCV) was up 17%, while U.S. Large Cap Growth (LCG) was only up 7%
· This year U.S. LCV is only up about 5% while U.S. LCG is up 18%

International Value and Growth Rarely Perform In Line
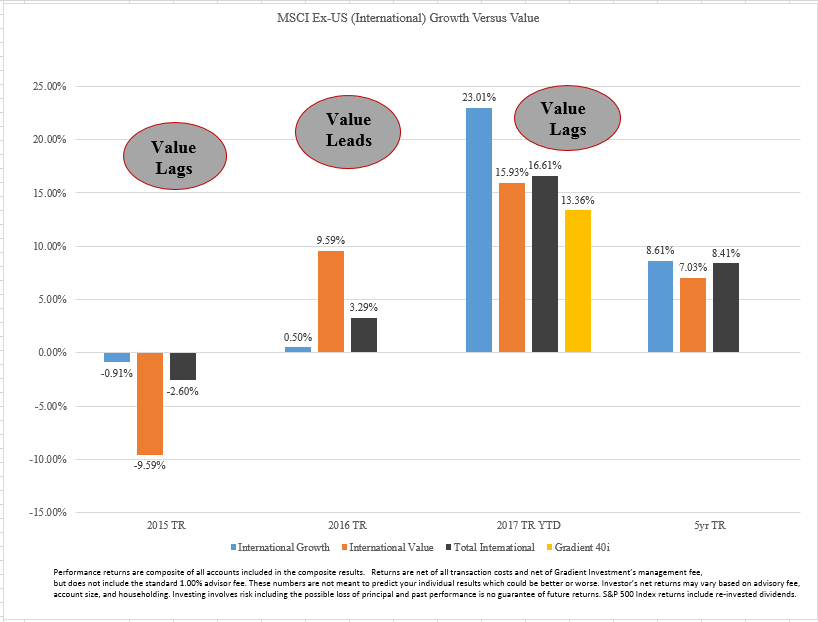
· In 2016 International Value was up 9.59% while International Value was up only 0.5%
· This year International Value is up 15.93% while International Growth is up 23.01%
Note the G40i inception date was December 31, 2016

When LCV outperforms the broad stock market we can expect the G50 and G40i to do well, and when LCG leads the market we can expect the G33 to do well. The investable universe of blue chip, dividend paying stocks that the G50 and G40i invest in are in the LCV half of the market. See the image below to see how the LCV and LCG sectors of the market are doing through August 31st, 2017:
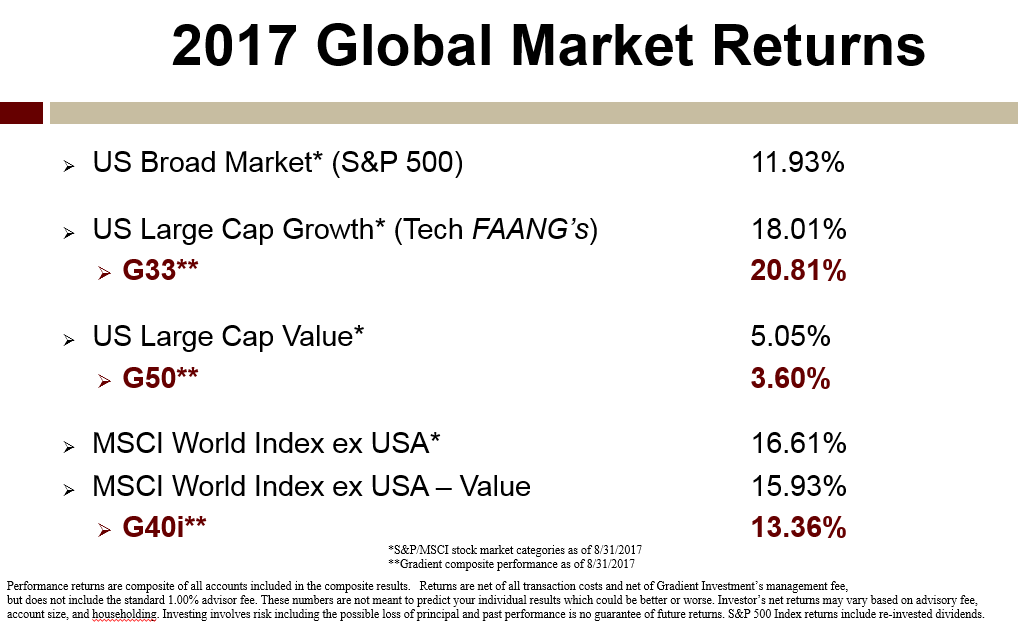
As with any form of investing, there are various levels to value and growth which entail higher or lower volatility of stock prices. We remind you to know your risk tolerance score and continue to incorporate that into your investment plan. We don’t want to get into a cycle of selling under-performing portfolios and buying portfolios after they have outperformed. That cycle will destroy value over time. Stay with your financial plan, then permit time to work on your behalf.

To expand on these Market Reflections or to discuss any of our investment portfolios, please do not hesitate to reach out to us at 775-674-2222.
 

Posted on September 11, 2017 Read More

Weight of Washington

Fundamentals drive market prices over the long-term. Things like corporate earnings, consumer confidence, employment, inflation, valuations, and economic growth matter greatly to the financial markets. There are times when political and geopolitical events can temporarily hijack markets. As the noise intensifies over Washington’s political agendas and national divisions, the market becomes more vulnerable to temporary price movements.

We experienced a spike in volatility in August and this scenario could repeat itself in the months ahead. Much of the so called, “Trump Rally” was based on expected pro-business reforms of lower taxes, better healthcare, fair trade and decreased regulations. The market loved the original message and is now in the process of distinguishing between hope and reality. While the media will do its best to sensationalize the struggles in Washington, the markets will ultimately respond to actual economic fundamentals.

Despite the uproar in Washington and tough talk on North Korea, the stock and bond markets took all the noise in stride producing flat to slightly positive results. Both emerging market stocks and the NASDAQ Composite were the best performing major indices this month posting 2.23% and 1.43% respective returns. Over the trailing 12-month period both had returns just north of 24%. The range of monthly returns was very tight as the worst performing indices (Barclays U.S. High Yield Bonds and international stocks represented by MSCI EAFE) both showed a minuscule decline of 0.04% in August.

In the U.S. stock market, winners and losers were determined either by industry or individual company results. The industry laggards were energy (again), healthcare and retail. Utilities, a long-time safe haven, had a good month supported by low interest rates and increased market volatility. Some second quarter earning disappointments severely punished some companies, while others had excellent results and were rewarded. Footlocker, Nike, Lowes, and Dicks Sporting Goods represented some of the retail carnage. On the flip side, companies like Norwegian Cruise Line, Blue Buffalo, Air Lease and Alibaba reported better than expected numbers and all reached new 52-week high share prices in August.

In the bond markets, interest rates stay low and credit spreads remain tight. This trend will continue into the foreseeable future. Economic growth would need to heat up into the 3-4% range to move interest rates higher. A major geopolitical event and or a serious stock market correction would be needed to jolt credit spreads wider. The current combination of low inflation, slow economic growth, and stable prices has the bond market in a very stable place.

Markets influenced by political events typically become buying opportunities. If the Washington rhetoric heats up and the fundamentals continue strong, averaging into a down stock market may offer a compelling proposition. If you are already invested at a risk appropriate level, avoid selling weakness and maintain the commitment to your long-term portfolio. Despite all the noise; people have jobs, the consumer is confident and willing to spend, and corporations are growing. This is a perfect foundation for success.

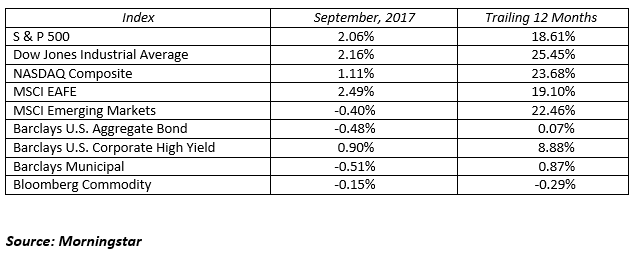
MARKETS BY THE NUMBERS: 

To expand on these Market Commentaries or to discuss any of our investment portfolios, please do not hesitate to reach out to us at 775-674-2222

Posted on September 5, 2017 Read More

Debt Ceiling Thoughts

For now it seems like news flow from both the White House and North Korea has slowed. With that, what are the financial news networks going to be discussing in the coming weeks? One item that will start getting more attention as we exit summer and enter September is the “debt ceiling” of the US Federal Government

Let’s discuss this in more detail. The debt ceiling is the maximum amount of money the US can borrow. This legislation essentially puts a ceiling (limit) on the amount of bonds the US can issue to pay its obligations (bills) such as Social Security, Medicare, government salaries etc. If Congress fails to raise the debt limit the Federal Government could theoretically go into default, which could cause severe economic consequences and volatility in the financial markets. This has never happened before.

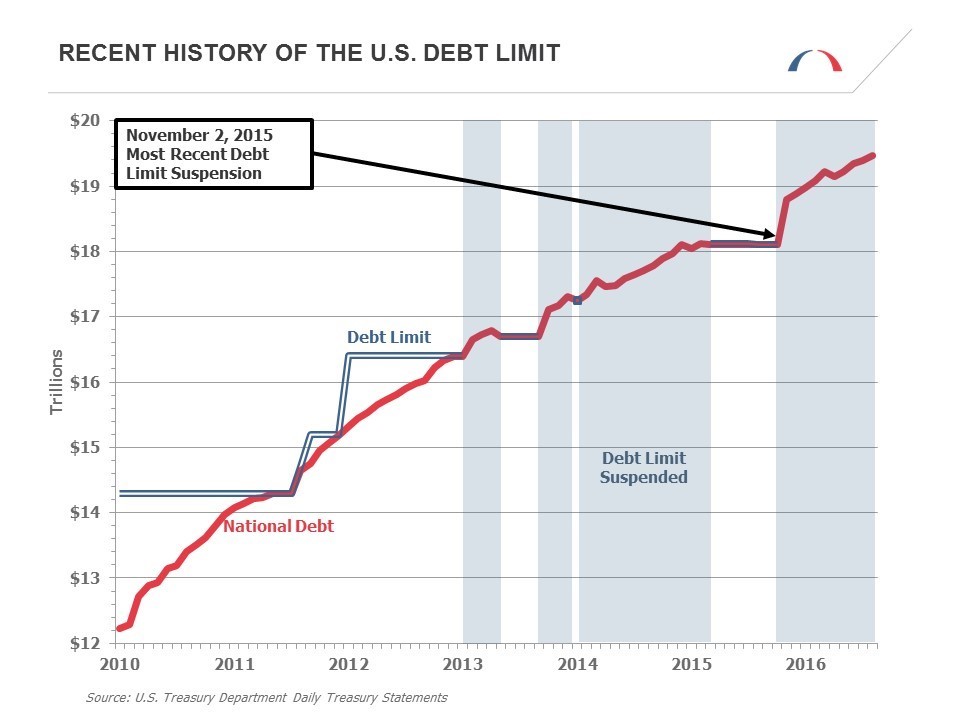
The current debt ceiling was suspended in November of 2015, but the suspension expired in March of 2017. The Treasury Department has been meeting its obligations since then by deploying “extraordinary measures”, which include legal and accounting maneuvers that allow the Treasury to temporarily finance current payments. Both Treasury Secretary Steve Mnuchin and the Congressional Budget Office agree that “extraordinary measures” will be exhausted by October of 2017. The chart below illustrates historical National Debt (red line) and Debt Limits (blue line):

Congress has raised, extended, or suspended the debt ceiling 78 times since 1960. They need to raise the debt ceiling again to a level over $20 trillion, and soon. We fully expect them to do so, but there will be a certain amount of grandstanding by both parties as they try to use debt ceiling negotiations as leverage for their positions on other issues such as healthcare, tax legislation and budget spending reform.

U.S. Treasury Secretary Steven Mnuchin recently addressed the “urgent need for lawmakers to raise the debt limit promptly when they return from recess” during a speech in Kentucky. And Senate Majority Leader Mitch McConnell said “there is zero chance, no chance we won’t raise the debt ceiling”. A Congressional debt ceiling deal will raise US government borrowing limits in order to cover the annual deficit it accrues. It will also allow the government to continue paying its bills. Stay tuned as debt ceiling headlines ratchet higher when Congress returns from their August recess.

To expand on these Market Reflections or to discuss any of our investment portfolios, please do not hesitate to reach out to us at 775-674-2222.

Posted on August 22, 2017 Read More

News Archive