Energy Inflection Point Upon Us?

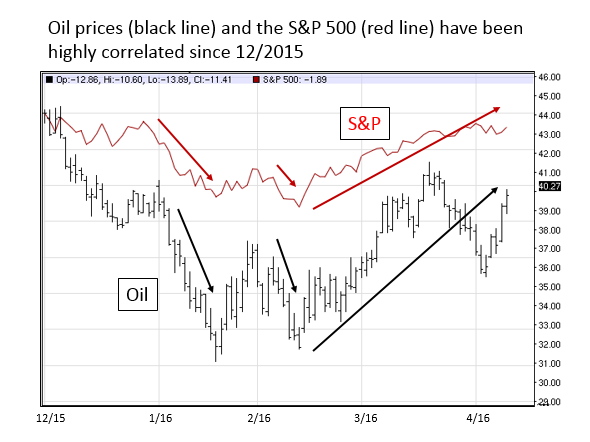
The stock market has rallied off the lows of January/February to stand slightly positive for the year. Part of the story has been the decline and subsequent recovery in oil prices during the first quarter. Oil prices and stock prices seem to be tied at the hip recently as illustrated in the chart below:
inflection 1

Oil prices seem to lead this correlation (oil up/market up and oil down/market down). Investors have been concerned that low oil prices would:

  • Hurt overall earnings growth of the S&P 500
  • Damage the high yield market if defaults rose in the energy sector
  • Slow the global economy as energy production declined

These concerns appear to be valid. As oil prices have declined since mid-2014, the market has stalled since late-2014. Oils decline has been caused by an oversupply situation across the world. Oil crashed from more than $100 a barrel to a low of $27. Sentiment was especially grim earlier this year, but recently this has changed. Investors are beginning to sense the supply/demand imbalance is beginning to correct itself and oil prices (along with the market) have rallied.

Is oil demand increasing and supply actually falling? Let’s look at some recent data points to see.

On the demand side of the equation a consensus of energy analysts seems to feel that global demand will continue to grow. The IEA (International Energy Agency) expects higher demand in 2016 versus 2015. Researchers at Bernstein expect global oil demand to increase at a mean annual rate of 1.4% between 2016 and 2020, compared with annual growth of 1.1% over the past decade. They also “expect oil markets to rebalance by the end of 2016”. Bernstein adds that it forecasts global demand to reach 101.1 million bpd by 2020, from the current 94.6 million bpd.

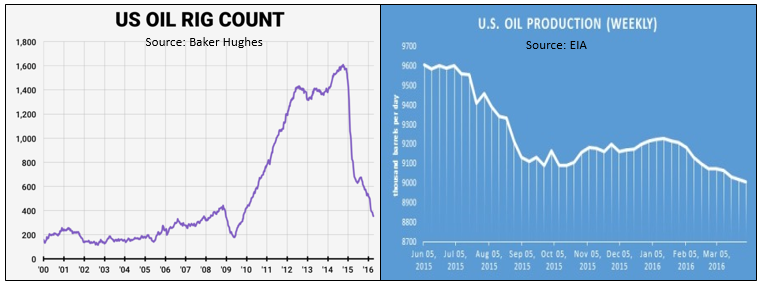
More importantly, growth on the supply side of the equation seems to be abating, especially in the US. In reaction to substantially lower prices, domestic exploratory oil rigs have been taken off line, and production is falling. See the charts below:
inflection 2

In short, as rig counts (exploration) fall, production eventually falls. This process takes time, but eventually is positive for prices.

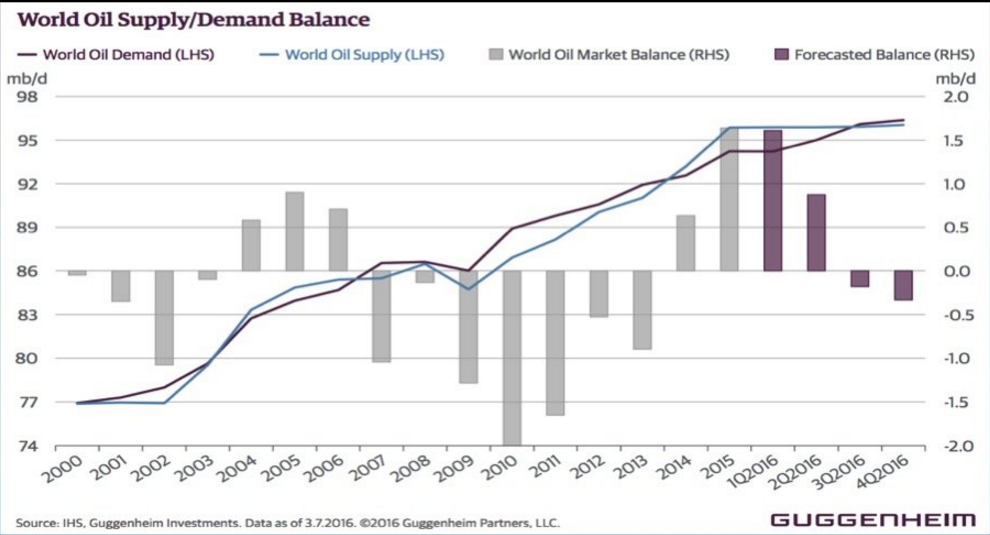
Finally, Guggenheim feels that global demand (purple line) will outstrip global supply later this year as non-OPEC production falls and world supply (blue line) flat lines. See the chart below illustrating this inflection point:
inflection 3

In conclusion, oil markets became over-supplied, but are self-adjusting through higher demand and lower supply. The adjustment process takes time, will be volatile, but is absolutely happening. If oil prices continue to recover over the next year, this should be a tailwind for the equity and high yield markets. The Gradient Energy Sector Portfolio was up close to 10% in the first quarter as its positions benefited from the recovery in oil prices. Further gains would be expected if oil finishes closer to $50 per barrel as we exit 2016, and $60 as we exit 2017.

To expand on these Market Reflections or to discuss any of our investment portfolios, please do not hesitate to reach out to us at 775-674-2222
Posted on April 12, 2016 Read More

First Quarter Market Review

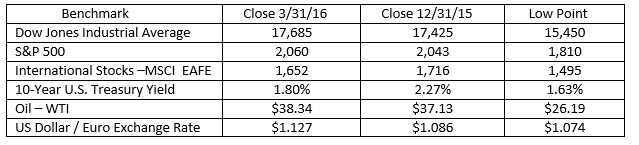
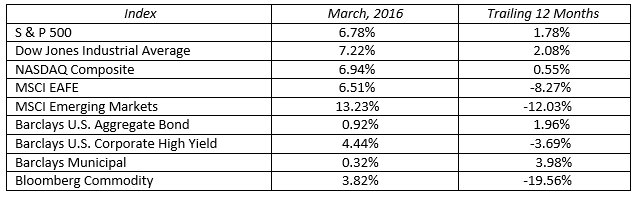
The financial markets traveled to new places in the first quarter only to bring us back and beyond where the journey began. It felt like a year’s worth of turbulence consolidated into three months. Despite the heightened volatility, large capitalization U.S. stocks, bonds and commodities all finished the quarter with positive returns. Let’s look at some key benchmarks.

PathQ1

The double digit stock market declines at the start of the year were caused by a variety of factors. The Federal Reserve raised the Fed funds rate by 25 basis point in December and set market expectations for multiple rate increases throughout 2016. This spooked the markets. Other factors dragging the market down included oil prices declining into the mid-twenties, the dollar strengthening, shrinking corporate earnings, a China slowdown and concerns that a major European bank might collapse.

The turning point came in mid-February as new realities came to light. The Fed’s pace of future interest rate hikes was going to be much slower than initially perceived. Fed chair Janet Yellen successfully talked down the U.S. dollar, turning corporate profit headwind into a tailwind. Oil prices rallied as the path to more balanced supply and demand came into focus. The European Central Bank (ECB) announced plans to embark on a more aggressive bond buyback program boosting European markets. Corporate earnings, while in a period of stagnation, are expected to be very strong in the second half as year over year comparisons will be favorable.

When we tone down the daily market noise and look at the big picture, the markets are reasonably valued. In the bond market, interest rates are low by historical standards; and we expect them to stay low throughout the year. The yield on 10-year U.S. Treasuries are trading in a tight range in a new sub-2% environment. Compare this to interest rates around the world and U.S. bonds look like a bargain. The Federal Reserve will impose just one 25 basis point rate hike this year, likely coming in the second half.

Stock valuations, as measured by price-earnings ratios, are running near their long term average of 15 times. A corporate earnings recovery expected in the third and fourth quarters has the potential to move prices higher into year end. The stock market swam upstream in 2015 as the strong dollar and falling oil prices took a significant bite out of corporate profits. These obstacles are now fading away providing a path to a better earnings picture later this year. Stock market volatility spiked in the beginning of the quarter and subsided as the market rebounded. Don’t be fooled. Volatility will be here for the remainder of the year as economic and political uncertainties will create bumps in the road.

The markets will always test investors’ resolve. If you monitor the markets and your portfolios on a daily basis, the bumpy road is more likely to throw you off course. It is important to remember capital markets do not move up or down in straight lines, but the long-term direction is upward. Keep a long-term market perspective on your financial plan and let the market work for you over time.

March2016

To expand on these Market Commentaries or to discuss any of our investment portfolios, please do not hesitate to reach out to us at 775-674-2222
Posted on April 5, 2016 Read More

Value/Dividend Paying U.S. Stocks Rebounding on Fundamentals

Growth stocks out-performed the overall market for the two years ending December, 2015. During that time growth stocks rose more than 15% while the S&P 500 rose by nearly 12%. Value stocks during the same time rose just about 8%. But conditions have begun to change.

We all understand what growth means, but just what do we mean by value stocks? They are those with the lowest valuations based on price to earnings (P/E), price to sales (P/S) and price to book value (P/BV). Over longer periods of time, many stocks move, or rotate, from growth to value and sometimes back again.

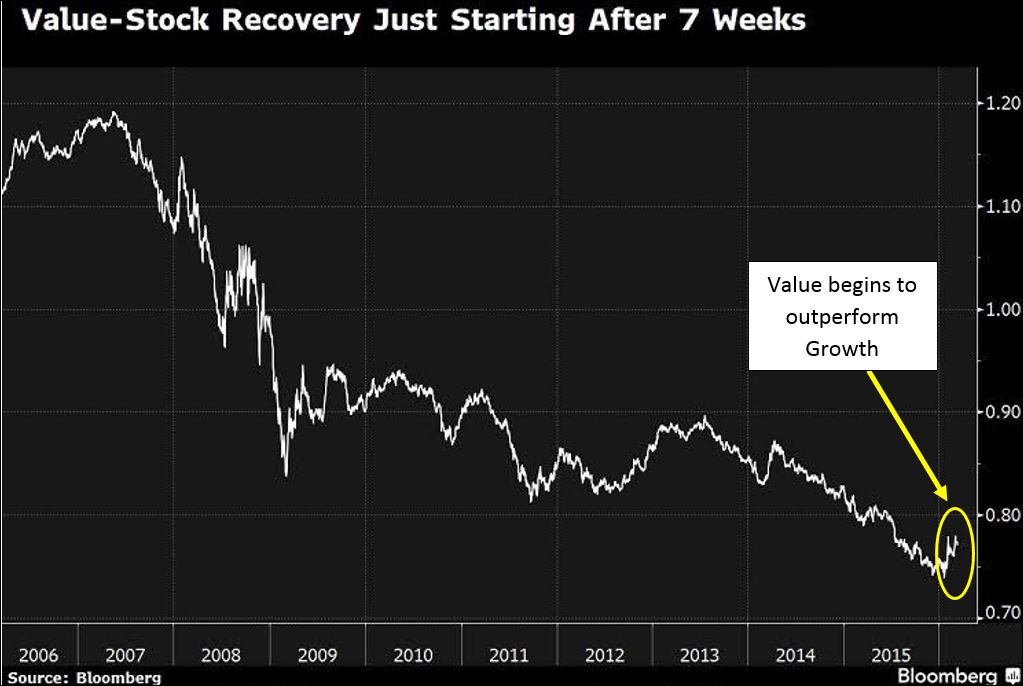
The dynamics that caused under-performance for value stocks for nearly two years have changed over the last two months. We can see this in the chart below where the line represents the ratio of the S&P 500 growth and value indices:

March 16 Mkt Reflection chart 1

Why have value stocks, particularly larger value stocks, under-performed for the last two years? We’ve had a few key headwinds:

· Growth in Europe and the emerging markets was slowing, affecting sales for large multi-national companies.
· The rising value of the US dollar challenged overseas sales and earnings growth for most US-based multi-nationals.
· Commodity prices, including oil, fell for three consecutive years which affected sales and profits for companies that rely on commodities for revenue.

In 2016 we have begun to see these headwinds turn into tailwinds:

· Oil prices have recovered from $27 per barrel, a 13-year low, to over $40 per barrel. We believe prices have likely bottomed and that the price will rise to the $50-60 range in 2016. What will drive the decline is falling non-OPEC production and increasing overseas demand, driving down inventories below expectations.
· Steady, low interest rates from the Federal Reserve since December are causing the US dollar to weaken to $1.12 per Euro from a low of $1.05 over the last four months.
· In commodities, plans are now in place to reduce supply, driving most commodity prices higher as global economic demand appears to be improving. We can see this in prices for most major commodities and also for shipping costs on a wide variety of commodities, which are recovering from a 30-year low.*

Apart from valuation metrics, we’ve seen those large cap, value stocks with their strong dividend yields gaining appeal as bond yields remain lower for longer. For instance, a market basket of large cap value stocks yield 2.8%** versus just 1.9% for 10-year US Treasury bonds.

Meanwhile, many fast growth, high valuation stocks winners of last year are faltering. For example, Amazon (AMZN) trades at 122 times forward estimated earnings per share, two times sales and 20 times book value. It pays no dividend. Year to date the stock price is down about 17%.

The Gradient 50 is an equally-weighted portfolio of 50 blue chip, dividend paying stocks that have these desirable low valuation characteristics. The G50’s total return (price plus dividend income) is out-performing the broad US stock market by over five percentage points year to date. We believe it is well positioned to outperform for the rest of 2016 since these companies tend to be:

· larger market capitalizations with exposure to higher growth in global markets
· paying dividends that yield 3.7% on average
· priced at lower P/E, P/S and P/BV valuations than the market average

Markets usually extend a trend longer than investors anticipate. For now Nevada Retirement Planners would prefer income and growth oriented investors allocate new equity dollars into the G50 portfolio. We continue to believe that market fundamentals will drive stock prices. These fundamentals are determined by the health of the overall economy and the profitability of the companies that operate within the economy.

To expand on these Market Reflections or to discuss any of our investment portfolios, please do not hesitate to reach out to us at 775-674-2222

*Source: “Baltic Index Slips Further, Hits New Record Low,” Reuters 2/10/2016

** Source: Vanguard VTV ETF fact sheet

Posted on March 23, 2016 Read More

News Archive