It Don’t Come Easy

Ringo Starr’s first big post Beatles hit was titled, “It Don’t Come Easy”. While Ringo was singing about love and relationships, he might as well been singing to investors dealing with volatile markets. Lines like, “Forget about the past and all your sorrows” or “Got to pay your dues if you wanna sing the blues”, or “I don’t ask for much, I only want your trust” are solid tips for these topsy-turvy markets.

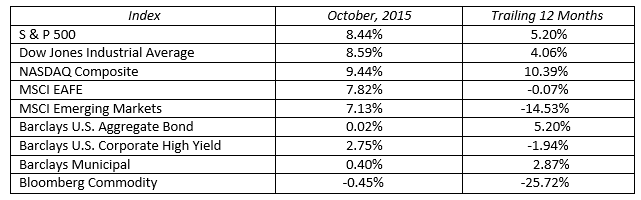
In unusual fashion, the October stock market was as good as September was bad. In October, all ten sectors in the S&P 500 showed positive results and the major indexes had their best monthly returns in four years. The leaders this month were the downtrodden energy and material sectors while financials lagged. Major stock markets around the world generated high single digit returns for the month. The October rally now gives the U.S. stock market a fair chance to post a record setting seventh consecutive year of positive returns. In the rear view mirror it all looks easy, but the string of short-term market corrections along the way continue to throw nervous investors to the sidelines.
11-3-15_image1

The economic backdrop has not changed significantly from September to October, rather the market’s perception of facts and expectations has repriced the market. The facts remain:

– The U.S. and global economies are in a slow growth mode.
– Central banks around the world are trying to help their economies prosper and grow via easy monetary policies and weak currencies.
– Interest rates are low.
– Third quarter corporate earnings are weak as advertised.
– Inflation is low and deflation is still a concern.
– Oil prices have temporarily stabilized in the mid $40 a barrel range.

While there will be plenty to worry about in the upcoming months, we are cautiously optimistic heading into 2016. Year over year comparisons will soon reflect the past impact of extended lower oil prices and a strong dollar; thus creating manageable hurdles to clear in the near future.

Statements from the U.S. Federal Reserve lead me to believe they will continue their accommodative monetary policies, although a token 25 basis point rate hike should be expected in December or early 2016. This may well be a “one and done” move until more economic data is known later in 2016. U.S. Treasury interest rates have been stable over the past year as depicted in the chart below.
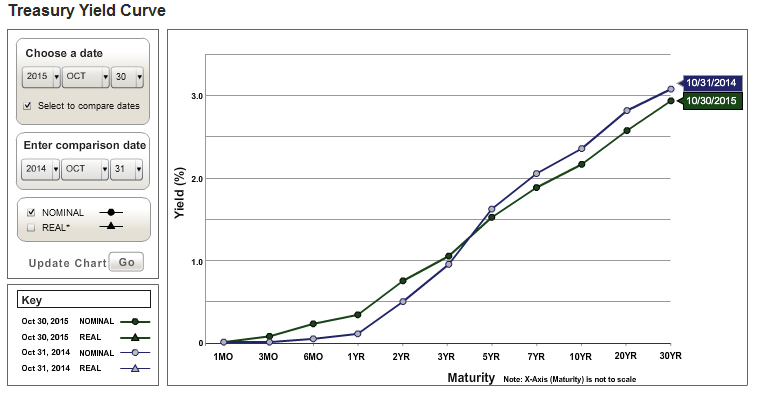
11-3-15_image2

Expect tight bond trading ranges in the months ahead. A yield on the ten-year Treasury visiting 2.00 percent when stock market worries run high and a 2.50 percent yield when stock markets are strong provides a reasonable trading range in this slow growth world. At the end of the day, expect bonds to deliver low single digit returns into the foreseeable future. Note the emphasis is on “low”.

Volatile markets always test investor resolve. It’s never a straight line up no matter how much we want it to be. Ringo had it right, “you know it don’t come easy”.
11-3-15_image3

Posted on November 16, 2015 Read More

Still at Square One

Ten months ago we forecast that things would be more difficult for the US stock markets in 2015. We looked at:

  • The slumping price of oil
  • The strong dollar
  • Near zero year over year corporate earnings growth
  • Above average market valuations


and surmised there would be a good chance stock markets would be flat for the year. Through October the US markets are indeed relatively flat, primarily as a result of sluggish corporate earnings growth. At this point we don’t see a lot changing through year end.

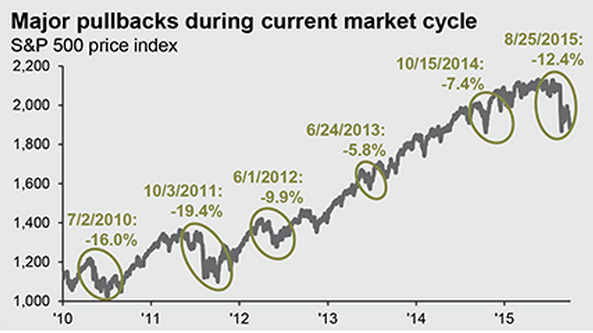
As 2015 progressed the US market was strong out of the gates (up close to 5%), started to fade into the summer, went through a volatile period (down 12% from the peak) in August, and subsequently recovered in October. The strong dollar and rock bottom oil prices are simply causing an “earnings recession” in the S&P 500 this year, and keeping stock prices in check.

The question is will an earnings recession turn into an economic recession. We don’t think so. In fact, the US economy is doing quite well, check out the data below:

  • Second quarter GDP was revised to a strong 3.9%
  • Consumers are increasingly confident
  • Household net worth is rising
  • Inflation remains low


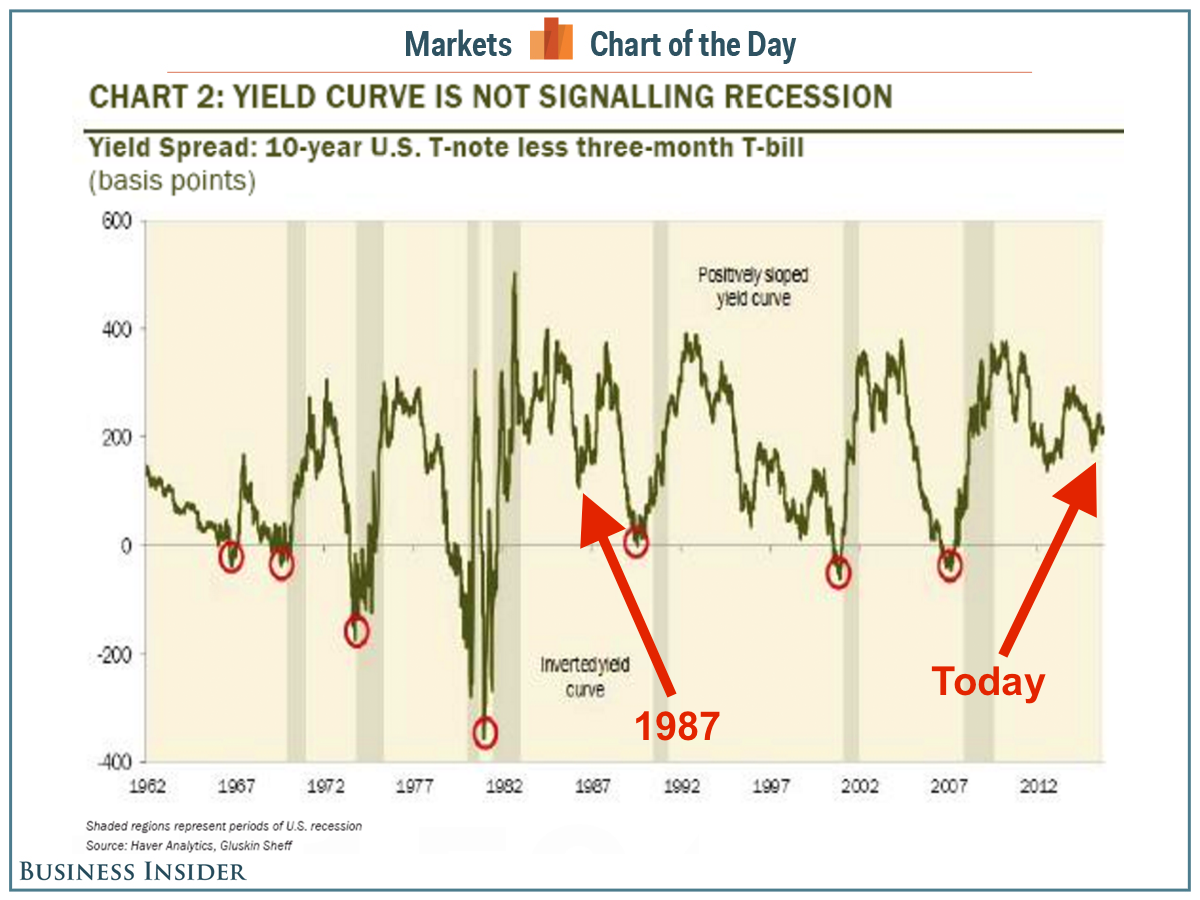
Despite good economic data there are still questions. If the earnings growth picture isn’t good, is there a chance we could go into a recession? One thing that’s signaled recent recessions is an inverted yield curve. This occurs when short-term interest rates become higher than long-term interest rates. The chart below shows how an inverted yield curve (red circles) signals an approaching recession and has occurred before every recession (shaded bars in the chart) dating back to the 1960’s:

20151022_1

Today the yield curve is positively sloped (10 year interest rates are at least 2% higher than short-term rates). This lends support to our belief that even though we’ll have market corrections (even like the big correction of 1987), a recession and an ensuing end to the bull market is not in the cards right now.

I think a disconnect exists between investor skepticism on the economy and actual economic data. The lack of earnings growth due to the effects of the strong dollar on corporate profits and low oil prices on energy sector profits is souring investors, but these effects are not permanent and could potentially become additive to earnings in 2016.

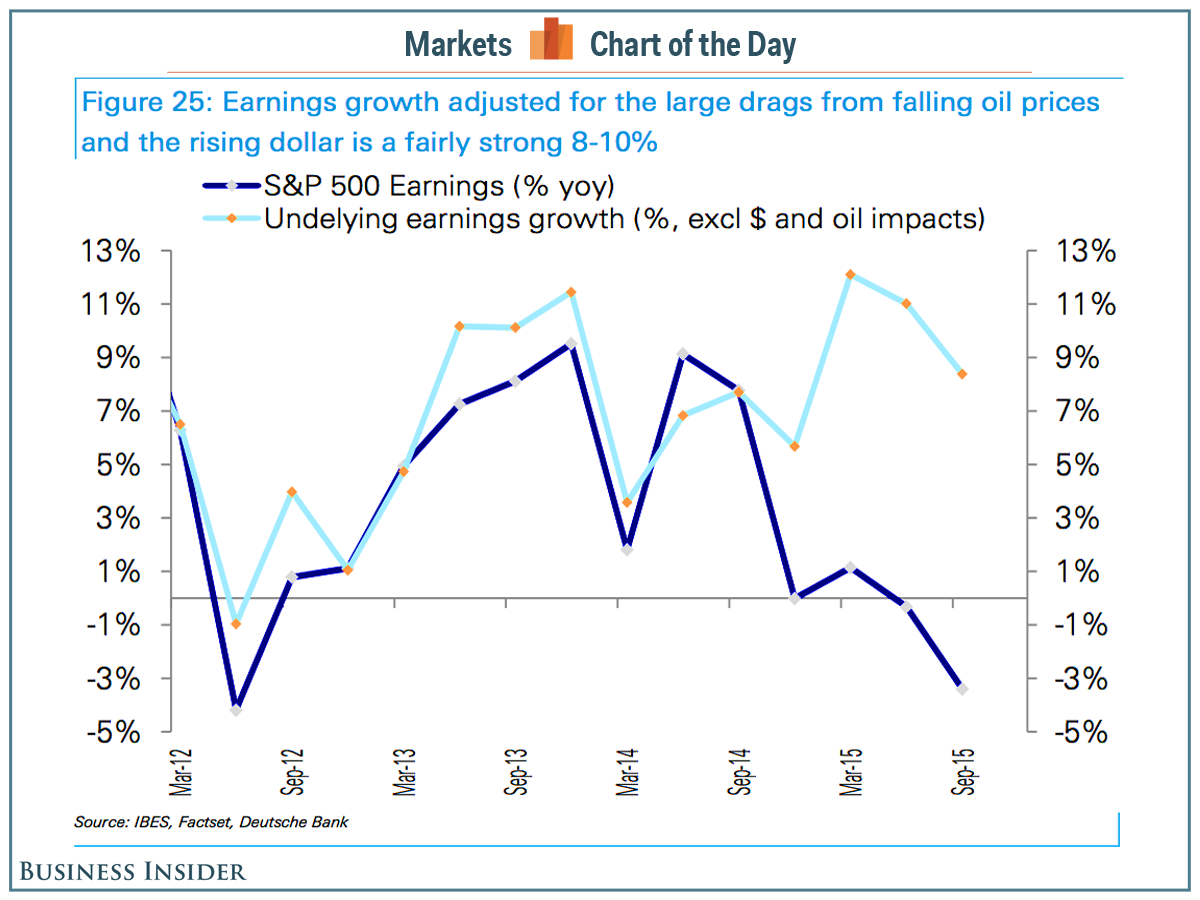
We know actual earnings in the 3rd quarter of 2015 will be down year over year, but what would earnings look like if we exclude the impact of oil and the dollar? The chart below shows actual 3rd quarter forecasted earnings of -4% (blue line) along with underlying earnings growth excluding oil and dollar impacts (light blue line):

 
20151022_2
If we strip out the temporary drag of oil and the dollar, underlying earnings growth is actually quite robust. All in all the economy continues to grow in 2015 and underlying earnings growth (ex oil and dollar effects) is good. This could potentially set the stage for a good 2016.

As of October 19th, 2015:

Dow Jones US Moderately Conservative Index is up 0.10% (TR) for the year

Dow Jones Industrial Average closed at 17,230 down 1.49% (TR) for the year

S&P 500 closed at 2,032 up 0.41% (TR) for the year

Russell 2000 closed at 1,163 down 2.35% (TR) for the year

MSCI Emerging Markets down 9.31% for the year

U.S. 10 year Treasury Futures are yielding 2.03% down 0.14% for the year

WTI Crude Oil futures closed at $45.92 down $7.79 for the year

Gold closed at $1,173 per ounce down $10 for the year

To expand on these market reflections or discuss other portfolio strategies please don’t hesitate to reach out to us at 775-674-2222.

Posted on October 23, 2015 Read More

Third Quarter Market Review

The third quarter was capped by a weak September which resulted in the worst quarterly stock performance in the last four years. After six years of positive annual returns a market correction was inevitable. While highly anticipated, the timing and the magnitude of a correction was unknown. The third quarter answered the timing question, although the jury is still out regarding the magnitude.

On the surface the market seemed irrational during this period of heightened volatility, but there were clear linkages between the cause and effect of economic events, policy decisions and market reactions. Let’s review what happened and suggest likely outcomes in the upcoming quarters.

Multiple factors aligned to create pricing pressure on stocks, high yield bonds and commodities in the third quarter. Downward pressure on commodity prices led by oil’s second leg down raised concerns about emerging market economies and the energy sector itself. The economic slowdown in China caused wild stock market swings within their market and this spilled over to stock markets around the globe. Central banks here and abroad rushed to relieve any short-term pain. In Europe, a U.S. style quantitative earning program is underway. In China, they devalued their currency which is pegged to the dollar. In emerging markets, there has been an expansion of local debt. In the United States, the Federal Reserve Bank decided to maintain their zero interest rate policy. The market interpreted this as a no confidence statement from the Fed and stock prices immediately fell. Add some geopolitical risk and the correction recipe is complete.

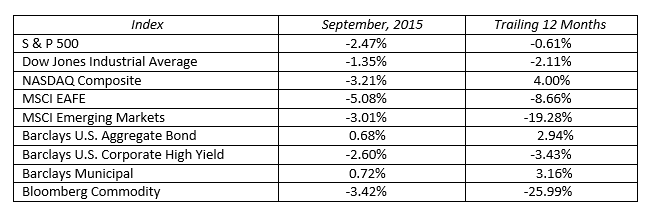
For the quarter, U.S. stocks continued to be the best horse in a weak field. The S&P 500 lost 6.44 percent, while the international markets were down 10.23 and 17.90 percent respectively, as measured by the MSCI EAFE and MSCI Emerging Markets indices. High yield bonds, which are highly correlated to the stock market, fell 4.86 percent during the period. This dragged both the year-to-date and trailing twelve month numbers into negative territory. Commodity price weakness continues to exasperate the markets, declining 14.47 percent in the quarter. The only bright spot was the investment grade bond market. The yield on the 10-year U.S. Treasury rallied back to the two percent level causing bond prices to rise. The Barclays Long-Term U.S. Treasury index was the best place to be this quarter with a 5.08 percent total return.

The message here is to hold diversified portfolios. As we begin to look toward the fourth quarter and into next year, we see stocks recovering and bonds maintaining value in a low interest rate world. The 2015 stock market struggles are functions of lower oil prices, a strong dollar, weaker than expected earnings, and slow economic growth. The commodity and dollar headwinds will turn into tailwinds in 2016 as values stabilize and earnings improve.

Volatile markets always test investor resolve. It has been smooth sailing for the past few years, and the third quarter was a rude wake up call. Successful investors have clear goals and objectives and the ability to remain focused on their long-term goals. This difficult quarter is setting the stage for a better 2016. Chart your course, stay your course.

MARKET BY THE NUMBERS:

Sept2015

Posted on October 14, 2015 Read More

News Archive