Fed Holds Interest Rates…Other Options Available

In a much anticipated announcement the Federal Reserve decided to keep the Fed Funds rate at the zero to 0.25 percent range. This is the seventh year the rate has been in this exact range, since it was cut in the throes of the recession in December, 2008.

Recall that the Fed has two mandates: controlling inflation and maximum, sustainable employment. So why did the Fed choose to maintain record low rates? The three main reasons were:

1. Very low inflation in the US Normally Fed rate hikes occur when inflation is on an upward trajectory. Inflation (ex-food and energy) for August was 1.8%, below its 2.0% target.

2. US jobs While the unemployment rate has come down to 5.1% from its 10% peak in ’09, those participating in the labor force are declining as a percentage of the total. This has been on the decline for seven years now.

3. A fragile global economy There were several mentions of China in the follow up commentary, and slowing global growth overall. Any US rate hike would likely divert investments from overseas markets. It would also further strengthen the US dollar, which in turn would further cut into sales of US products to overseas markets, impacting US multinational companies.

The decision was not unanimous, however. The dot plot shown below indicates each Fed member’s rate expectations. Of the 17 voting members, 13 selected a higher interest rate range by the end of this year. The plot also shows that Fed members project rates will be even higher in the coming years, to the 3.5% area at the end of 2018 and longer term.
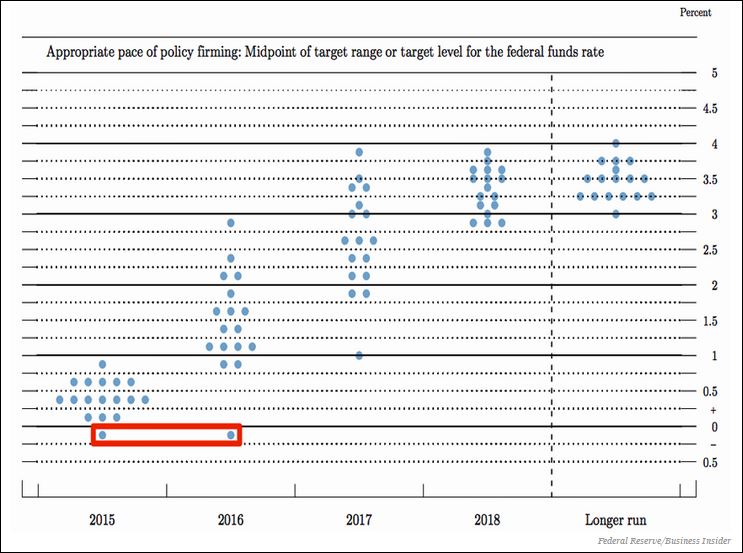
Fed Funds Dot Plot

Does this mean that the Federal Reserve is currently taking a hands-off policy on the US economy?

We don’t think so. What most people don’t realize is that the Fed is equipped with other tools besides changes to the Fed Funds rate when it seeks to heat up or slow down our economy. Some of these tools are:

  • The “overnight” discount rate which the Fed effectively pays banks for keeping money set aside from lending. By reducing the discount rate, banks are given more of an incentive to lend their deposits to growing businesses.
  • Buying and selling securities. As we’ve seen with three quantitative easing (QE) programs over the last several years, the Fed can buy up or sell off securities in an effort to change rates.
  • Public statements. The Fed will give forward guidance about the path for short-term interest rates. These statements tend to move markets prior to any official rate hikes.

Oftentimes, as shown in the graph below, the Fed encourages early market moves in interest rates since their decisions are based on data that is generally accessible. In the yellow boxes we can see that market interest rates (the blue line) move before the Fed changes the actual Fed Funds rate (the red line).
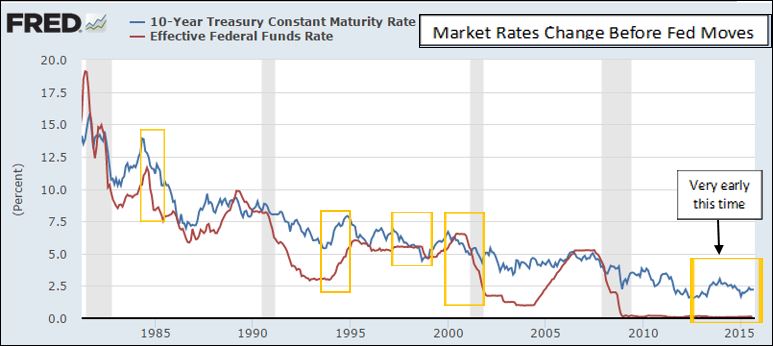
Market Reflection Two 9-2015

We may see a drop in the “overnight” lending rate in the coming weeks in an effort to stimulate US economic expansion. Back in 2007, the Fed expanded this service to as much as 30 days. We will be watching closely for changes to the program, since there are usually no announcements.

We believe a rate hike to the 0.25 to 0.50 percent range over the next six months (perhaps as early as next month) is being telegraphed by ongoing Fed governor commentary. When they do raise rates, we believe it will be interpreted as positive for the stock markets as it will indicate that the US economy and corporate profits are on more solid ground within a larger, global scope. Additionally, we believe that further rate hikes will be gradual (lower and slower). This was part of Fed Chair Yellen’s presentation to Congress last spring, that a more gradual path was a prudent approach.

So long as we do not have runaway economic growth and roaring cost inflation, which we do not expect, we believe a normal 10-year Treasury bond range of 2 to 4 percent is likely for the next several years.

As of September 22, 2015:

Dow Jones US Moderately Conservative Index is down 1.97% (TR) for the year

S&P 500 closed at 1,942 down 4.21% for the year

Russell 2000 closed at 1,143 down 4.26% for the year

U.S. 10-year Treasury Futures are yielding 2.13% down 4 basis points for the year

WTI Crude Oil futures closed at $45.13 down $8.58 for the year

Gold closed at $1,132 per ounce down $51 for the year
Posted on September 24, 2015 Read More

This Is Only A Test…

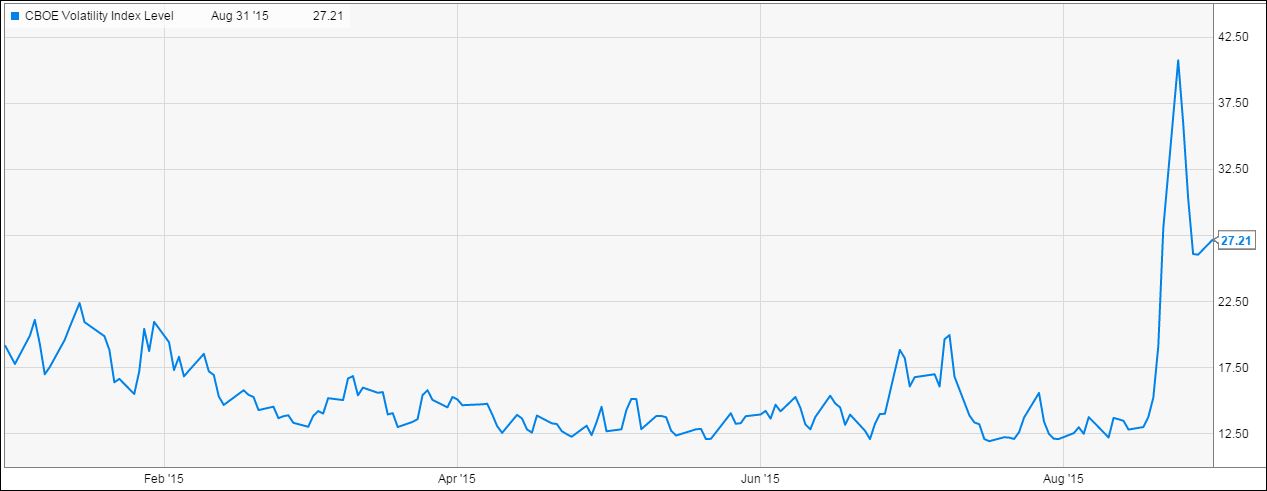
If this had been an actual emergency, you would have been instructed to buy gold and turn off the television. Seven months of flat markets tested patience, and the August stock market correction tested resolve. A 10 percent equity market correction in a handful of trading days is a serious gut check and a reminder that volatility lives.

The volatility index (VIX) chart of activity year to date shown below clearly shows the volatility alarm sounding in mid-August.

Aug 2015 Commentary YTD VIX chart

Portfolios provide valuable feedback on the risk we own. An instant correction, like the August experience, allows us to put personal dollar signs on the market move. It acts as both a financial and an emotional checkpoint. Use this mid-term exam as a chance to ask yourself:

– Do I have a financial plan that considers income, expenses and reasonable growth expectations?

– Do I have too much risk in my portfolio? Too little risk?

– Do I have enough liquidity? Am I positioned to take advantage of market opportunities?

– Emotionally, how did I handle the correction? Was I thinking about buying the sell-off or sprinting to cash?

The U.S. stock market has generated six consecutive years of positive returns, and a record breaking seventh year is questionable at this stage. During August the stock market provided the elusive 10 percent correction from its May peak that everyone was waiting for, so now what? The correction’s origin was rooted in China as slower expected growth from the world’s number two economy sent commodity and stock prices lower. We expect the remainder of 2015 to be a power struggle between the bulls and the bears. The final answer for 2015 is likely to be a flat year. This third quarter correction becomes next year’s opportunity.

We see 2016 having better corporate earnings as a strong dollar and weak oil prices are already reflected in the numbers. We believe the 2016 year-over-year comparisons will be viewed favorably by the global equity markets.

The U.S. bond market provided temporary shelter to an unsettled stock market. Stock volatility sent bond prices higher and interest rates lower. In a typical flight to quality, the 10-year U.S. Treasury yield dipped to a 1.90 percent yield before settling into a month end yield of 2.21 percent, virtually unchanged from the end of July. Meanwhile the 30-year Treasury yield finished up 3 basis points to 2.95 percent.

The Fed Funds rate debate continues, and investors now speculate whether it will be September, December or early 2016 for the first rate hike. Some of the data point to a September hike, but December seems most likely to me given the market jitters. With six years at zero interest rates, what’s a few more months? More interesting will be what the Federal Reserve reveals in its first meeting following the eventual rate hike.

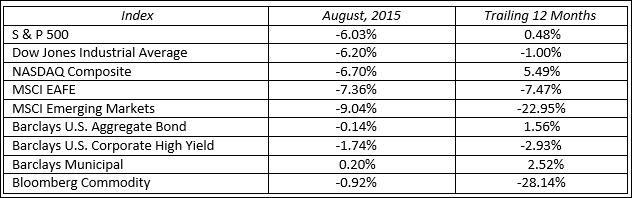
Stock markets had a tough but resilient month as prices recovered somewhat at month-end from larger losses in the third week. The S&P fell 6.03 percent while higher-risk NASDAQ stocks declined 6.70 percent. Utilities was the best performing sector, while Energy was the worst.

The broad Bloomberg Commodity Index provided a bit of relief for the diversified investor. After months of negative returns the index posted a slight 0.92% dip in August as energy prices, a key component, posted sharp gains in the final days of trading.

Volatile markets test investor resolve. It has been smooth sailing for the past few years, and August was a great reminder as to why we diversify portfolios and manage risk. Successful investors have clear goals and objectives, remain focused on their long-term goals and stay resolute during their financial journey. The remainder of 2015 will continue to test investor resolve. This is a healthy exercise and will yield long-term benefits.

MARKETS BY THE NUMBERS:

Aug 2015 MARKETS BY THE NUMBERS


Posted on September 1, 2015 Read More

Acknowledging Market Corrections

The stock market has corrected approximately 10% from its May 2015 peak and volatility has increased. This is a correction, but hasn’t entered “bear market” territory (defined by a 20% decline).

Last week the Dow fell more than 500 points Friday, dropped another 1,000 points on Monday morning before finishing down 588 points for the day. Major stock markets across Europe and Asia also closed sharply lower, with risk assets (commodities, emerging markets, and high yield bonds) hit the hardest.

What’s behind the correction?

  • Evidence of a further deceleration in China’s economy
  • General concerns over global growth and collapsing inflation expectations
  • Chances of a Fed interest rate hike in September diminishing
  • Falling oil/commodity prices, suspected to be caused by weakening demand


All of this sent investors scurrying for the safety of bonds and gold:

  • The yield on the US 10 year Treasury Note fell below 2.00%
  • Gold has begun to rise in price off its bottom


At the beginning of the year we forecast a flat market (+5%/- 5%) for 2015. We saw lower oil and a stronger dollar hurting corporate profit growth, along with a market that was a bit on the rich side, keeping stock prices in check for the year. As of today we don’t see any reason to deviate from this forecast.

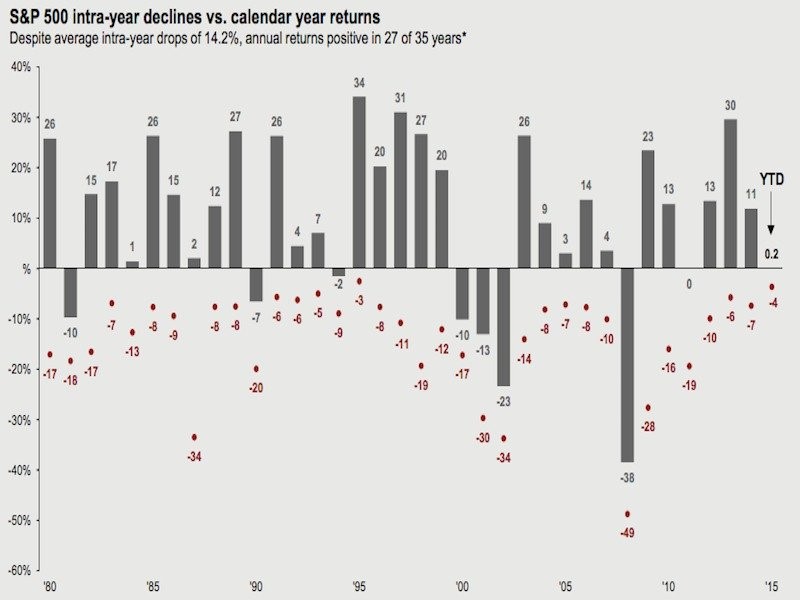
Market corrections are tough and many may tend to panic. This is a good time to remember that big sell-offs occur all the time, even in years when the markets are up. The chart below highlights the fact that stocks don’t go up in a straight line:

corrections*chart provided by JP Morgan Asset Management

The green bars are the annual returns for the year, and the red dots are the intra-year corrections from a peak to a trough that occurred during the year. This is a good chart to remind us that:

“Despite average intra-year drops of 14.2%, annual returns have been positive in 27 of 35 years”

What’s happening in the markets is stressful, but also routine. And while there could be more selling, historically the odds of that happening are actually low. Below are some statistics on market drawdowns/corrections provided by Josh Brown (the reformed broker). Since 1957 there have been:

  • 48 drawdowns from all-time highs of 5%
  • 17 of 48 became 10%
  • 9 of 48 became 20%+


Corrections normally occur every 12 to 16 months. The recent drop seems so sever because the market hasn’t fallen this much in four years. Here’s what we suggest during periods of extreme market volatility:

Remember your time horizon. Stocks are still up substantially since March 2009. You have to take the good with the bad. If you don’t need the money now, why worry about a one-week drop? Markets tend to eventually recover.

Remember why you own various asset classes. A diversified allocation of stocks, bonds and alternatives will buffer your individual portfolio returns in volatile markets.

Keep your perspective. The Dow lost 3.6% on Monday. On Black Monday in October 1987, the Dow lost 22%. Recent stock declines are big but not crashes, when viewed on a percentage basis.

Sell a little if you must. If you think we’re cascading into a bear market, take some money off the table. But don’t attempt to time the market and bail out of stocks completely. If you’re wrong, you’ll likely miss the rebound.

What now?

Volatile markets create opportunity and GI is assessing conditions that take advantage of those opportunities. In fact, we see reasons to be optimistic for those with the proper time horizons:

  • The economy is in much better shape than it was in 2008
  • In Europe, recent data suggests their economy is starting to grow again
  • High yield bonds are cheaper and default rates remain low
  • Stock are on sale. The S&P 500 price/earnings ratio is now 14.8X forward earnings, below its 25-year average of 15.7X
  • In 2016 corporate earnings are forecast to grow approximately 10% versus 2% this year


We will continue to monitor the US and global investment markets to assess the fundamentals versus our expectations. Remember, “despite all the corrections and bear markets over the past 50 years, investors have seen compounded returns of 6.6 percent, far in excess of the inflation rate of 3.6 percent” says Andy Rachleff of Stanford. If emotions get the better of us during corrections, this type of long term return will be difficult to achieve.

As of August 24th, 2015:

Dow Jones US Moderately Conservative Index is down 2.33% (TR) for the year

S&P 500 closed at 1,894 down 6.81% for the year

Russell 2000 closed at 1,111 down 7.00% for the year

U.S. 10 year Treasury Futures are yielding 2.06% down 11 basis points for the year

WTI Crude Oil futures closed at $38.24 down $15.47 for the year

Gold closed at $1,152 per ounce down $31 for the year

To expand on these market reflections or discuss other portfolio strategies please don’t hesitate to reach out to us at 775-674-2222.

Posted on August 25, 2015 Read More

News Archive