Assessing Performance

When discussing investments, a common and important question to ask is “How am I doing?” When investors examine returns, they are usually looking at a percentage return over a specified time frame. Understanding what that number means for them, however, can be a challenge. To give context to their returns, investors may turn to benchmarks or indices (like the S&P 500) to assess their performance relative to something else. While this can be an understandable approach, it can be misleading in certain circumstances and potentially risky if it leads to bad decision making.

As an example, consider the following two investors:

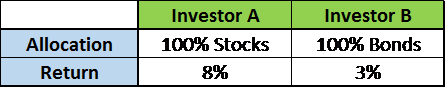
In the above example, how is Investor A doing? Investor B? The answer, as in many things, is “it depends”. For example, what if Investor A was fully invested in stocks when stocks were up 30% during the same period. Secondarily, what if Investor B was fully invested in bonds when the average bond performance was negative. Does that change the answer?

To add another layer, what if Investor A (100% stocks) is 80 years old and required consistent income and portfolio distributions to meet their expense needs. For Investor B (100% bonds), what if they are 25 years old, have a high tolerance for risk, and will not need distributions from these assets for another 40 years. Does it change the answer again?

The point of this exercise is not to further confuse the situation. It is simply meant to show that performance is relative, not only to benchmarks, but to each individual client financial objectives. An 80 year old investor who is reliant on portfolio distributions to meet their expense needs is significantly different from a 25 year old investor whose primary goal is to grow their assets. Therefore, their portfolio needs, and their overall performance, should also be judged very differently.

How investors determine their performance should be relative to their personal situation. Performance should be discussed in context of their investment plan, based on risk tolerance, time horizon, and income needs. Once an investor’s financial plan is built, there should be a clear understanding of what assets are in the portfolio and their primary objective. A simplified examination could look like this:

  • Cash: The purpose is for asset preservation and liquidity
  • Bonds: The purpose is for income generation and risk reduction
  • Stocks: The purpose is for long term growth, or a hybrid of growth and income, with increased risk

Without this understanding, investors looking to assess “how they are doing” may be misled by using one benchmark that doesn’t consider the client’s individual situation and objectives. Further, they may be led to action (“performance chasing” or “flight to safety”) that does not align with their long term objective and risk tolerance. Over time, this has the potential to detract from value.

To expand on these Market Reflections or to discuss any of our investment portfolios, please do not hesitate to reach out to us at 775-674-2222.

Posted on June 26, 2018 Read More

We Like The Set Up

Last year international stock markets finally woke up after several years of underperforming their US counterparts. In 2017, both the emerging markets and the international developed market indices outperformed the S&P 500. Most stock market strategists and investors expected this outperformance to continue in 2018. Instead, international markets are down slightly and the US markets are up low single digits. What’s happened? Several things have contributed to the pause in performance this year including:

  • Trade policy concerns as the US and its trading partners propose new tariffs against each other
  • A strong dollar, which is a headwind for international stocks
  • European economic growth concerns if Italy leaves the Eurozone
  • US corporate profits have received a one-time boost due to tax reform while European profit growth has underwhelmed

The question is are these temporary issues for international markets or are they secular. In our opinion, the challenges are more short term in nature and we see opportunity in the international stock markets. Why?

We believe the international stock markets are at an earlier stage in their rising corporate earnings cycle and their overall valuations are cheaper. The chart below highlights the price to earnings (PE) multiple of international stocks (blue line) versus US stocks (red line). International stocks are currently about 15-20% cheaper than US stocks.

It’s always worthwhile to see if others agree with our viewpoints in case we’re missing something. We’ve indeed found that other firms concur with our thoughts on the international markets. For example:

Goldman Sachs Asset Management (GSAM) has a positive outlook on equities overall, but sees the emerging markets as the most attractive. See the table below highlighting the recent upgrade (red box) of emerging market equities:

State Street Global Advisors (SSGA) forecasts strong Emerging Market returns (red box) both in the next year and the next 3-5 years. See the bar charts below highlighting forecasted asset class returns:

Finally, JP Morgan Asset Management Group recently stated in their Global Equity View 2Q 2018 that
“emerging market equities remain a favorite and Europe is more appealing after recent underperformance.”

To summarize, we acknowledge that international stocks have been underwhelming in 2018 thus far. We’ve seen that in the underperformance of the G40i which is invested in international blue chip companies and also in the GTR which has been invested in the emerging markets. Looking at the back half of 2018 we are constructive on the opportunity in international stock markets, the G40i and the GTR. With healthy international economies and stock markets that are trading at a discount, we like the set up for the rest of the year.

To expand on these Market Reflections or to discuss any of our investment portfolios, please do not hesitate to reach out to us at 775-674-2222.

Posted on June 13, 2018 Read More

Reasons To Believe

Last month’s political headlines heightened everyone’s anxiety. Fortunately, the month of May provided an opportunity for investors to take a breath and refocus on the solid fundamentals underlying this long running bull market. Let’s look at some of May’s highlights which gave investors reasons to believe:

· First quarter corporate earnings grew at 24.6% year over year

· Valuations of the S&P 500, as measured by price earnings ratios, declined to 16.4 times forward earnings per share from 20 times at year end

· Employment situation supports a strong economy and a confident consumer – modest job growth along with a 3.8% unemployment rate

· Federal Reserve keeps fed funds rate unchanged

· April consumer price index reported lower than expected inflation

· April producer price index reported lower than expected inflation

· Monthly retail sales showed modest gains despite poor weather

· Consumer confidence recorded a 128 reading, a historically strong number

The skeptics have their reasons for being negative on the market and the world in general. Their arguments will include:

· Higher interest rates will choke off the stock market rally

· Higher oil prices (hit $80 in May) will lead to higher inflation

· The Federal Reserve’s monetary tightening will curb future economic growth

· Political risks surrounding trade wars, NAFTA, tariffs, and saber rattling will weigh on the markets

Every market over time has its own wall of worry to climb. This is normal. In the big picture, corporate earnings are outstanding and valuations have transitioned from rich to fair. Invest with confidence.

U.S. stock markets got some of their mojo back with moderate gains across the board. Strength in the technology sector put the NASDAQ Composite in the pole position for the month and for the trailing twelve month performance. It returned 5.50% in May followed by the S&P 500 at 2.41% and the Dow Jones Industrial Average at 1.41%. International stocks did not fare as well in May with the MSCI EAFE down 2.25% while the MSCI Emerging Markets lost 3.54%.

From a sector standpoint the market found leadership in technology, real estate investment trusts and energy as oil price climbed to recent highs. The laggards were consumer staples, communication services and the long forgotten utilities sector.

The bond market flirted with a 3.00% yield on the 10-year U.S. Treasury Note for an extended period before it finally broke through mid-month. Then political concerns in Italy and the potential impact on the European Union caused a flight to quality trade as investors flocked to buy U.S. Treasuries. For the month, the benchmark 10-Year U.S. Treasury yield decreased 8 basis points to 2.83%, down from its May 17th closing high yield of 3.11%. The 2-Year Treasury declined 9 basis points to end the month yielding 2.40%, while the 30-Year Treasury fell 11 basis points to yield an even 3.00%.

The yield curve flatten modestly in May, but retains its positive slope. An inverted or negatively sloped yield curve has received considerable attention in the past few months. An inverted yield curve (one where short-term interest rates are higher than long-term interest rates is rare), has accurately predicted the last three recessions and stock market tops. There is no need for immediate worry. After the yield curve goes inverted, a stock market top is 10 months away on average and a recession is 15 months away on average.

The Berkshire Hathaway annual meeting was held in Omaha, NE this month. This two day event with legendary investor and company founder, Warren Buffett, receives massive media coverage. This is the one time each year when the media focuses on investing rather than trading. Here at Gradient Investments, we strive to promote the benefits of long-term investing, just like Mr. Buffett. Unfortunately, the financial headlines and hype presented in the media every day is so often driven by very short –term trends and trades.

Are you an investor or a trader? Hopefully you are an investor. If not, start by filtering all of the daily background noise and allow yourself to take a longer-term view of the world and become a world class investor.

MARKETS BY THE NUMBERS: 

To expand on these Market Commentaries or to discuss any of our investment portfolios, please do not hesitate to reach out to us at 775-674-2222

Posted on June 6, 2018 Read More
Call Us: (775) 674-2222