What Are The Bond Markets Telling Us About The Stock Markets

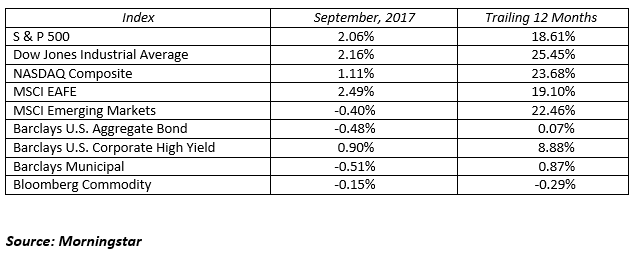
We’ve long talked about the high correlation between stock prices and market fundamentals. The fundamentals are highlighted below:

  • The health of the economy: it’s been growing at a moderate and stable pace
  • Corporate earnings growth: they’re forecasted to grow 10% this year and in 2018
  • Company and market valuations: they’re on the rich side, but not extreme

One metric that tends to go unnoticed is how the stock market also benefits from low interest rates. Lower interest rates generally make stocks look more attractive. The thesis is that if investors can’t earn a reasonable return in the fixed income markets they’ll look toward stocks to earn a higher, albeit more volatile return. Many Wall Street strategists are currently looking at the bond market as another avenue to judge the direction of the market. Two items that could give them concern are:

  • A rising 10-Year Treasury yield
  • An inverted yield curve (10-Year rates lower than 2-Year rates)

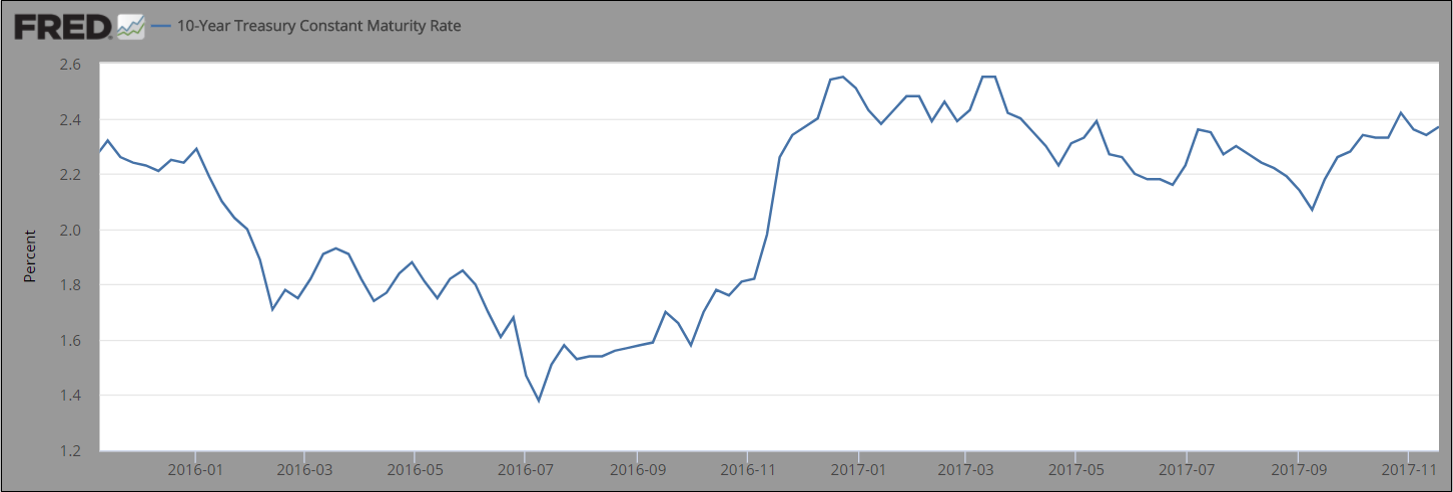
Interest rates have been low for a long time, and continue to be low. The Federal Reserve Bank (the Fed) has raised the “Fed Funds Rate” four times since December of 2015, after leaving it at zero for seven years. The 10-Year Treasury yield bottomed at 1.37% in July of 2016 and trades at 2.33% today. Longer term the 10-Year has averaged around 4.00%. If the 10-Year yield continues to rise between 3% and 4% levels, the returns of stocks and bonds will become more equalized and investors could be incented to rotate from stocks to bonds. The 10-Year Treasury yield is graphed below:

Another bond market chart that many strategists are watching is the spread between the 2-Year Treasury and the 10-Year Treasury. When the spread is positive we have a “normalized yield curve”. When the spread is negative we have an “inverted yield curve”. Recently the bond market’s yield curve is becoming flatter. This means longer term (10-Year) interest rates are slipping towards shorter term (2-Year) rates. The concern here is that a flat, or even an inverted, yield curve in the past has signaled a recession. The chart below highlights the spread between 10-Year and 2-Year yields; it’s still positive but becoming much flatter:

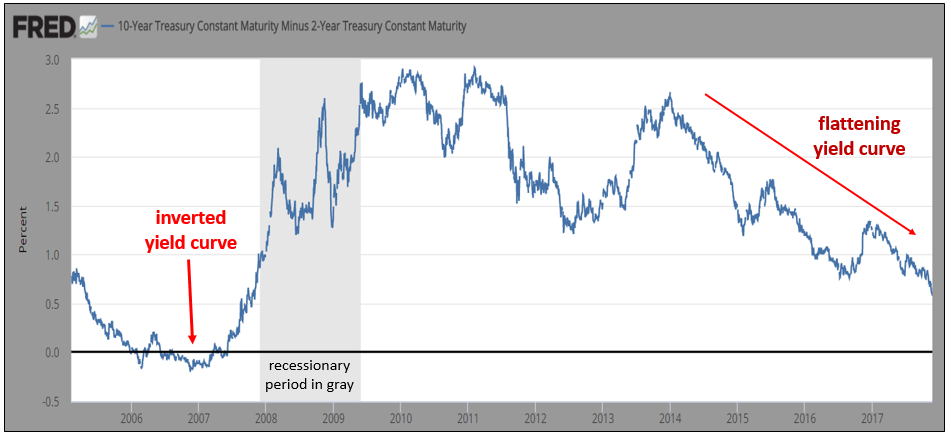
The US yield curve is now at its flattest point in roughly ten years. The gap between 2-year and 10-year yields has shrunk to just 0.58 percentage points, the lowest since 2007. In the past an inverted yield curve has been an indicator of an upcoming economic recession. We’re not inverted yet, but investors are closely watching this indicator as the gap shrinks.

Interest rates that are too high, or a yield curve that is too flat can cause concern amongst investors. We don’t believe 10-year interest rates are too high yet at 2.33%, but the flatter yield curve is something to watch as lower longer term interest rates tend to signal investor expectations for weaker economic growth and lower investment returns in the future. We are not there yet, but an inverted yield curve would certainly be a yellow flag for the investment markets and we’re watching this metric closely.

To expand on these Market Reflections or to discuss any of our investment portfolios, please do not hesitate to reach out to us at 775-674-2222.

Posted on November 28, 2017 Read More

Black Monday 1987: What’s Changed?

Thirty years ago this week, the stock market had been very strong since the start of the year and investors vacillated between greed and anxiety. The Dow Jones Industrial Average (DJIA) peaked with a 43% gain by August that year, and had retreated by more than 16% from its peak. Then on October 19, 1987 the DJIA plunged nearly 23% on that one day for the single most horrendous panic-induced selling in Wall Street history, commonly referred to as Black Monday.

What caused the drop? In the prior five years, stocks were up 229% on average while the cumulative earnings per share had grown just 17%, so valuations (price to earnings ratios) had expanded hurriedly. Investors were jittery about high interest rates potentially choking off much-rumored acquisitions and general economic growth. Worries were building that stock gains could not be sustained through year end. Washington floated the idea of a new, higher tax proposal and investors hated it. On Friday of the prior week, stock prices were dropping.

When the markets opened that Monday, sell orders were too numerous for existing systems to function properly and program trading ensued, dumping more and more stocks as they declined. New and complex hedging strategies utilizing derivatives had been introduced in the 80’s, adding to the toxic avalanche. Financial regulators didn’t know how to deal with the situation.

State-of-the-art Quotron machines that reported the price and volume of each stock’s trading via phone lines onto paper at brokerage offices across the country were running sorely late–about 45 minutes behind each trade. Thus an order to sell a stock at the market price was a shot in the dark. Confirmations could not keep up with the trades either, so most didn’t know how their trade was executed until days later. In current terms, a fall of the same magnitude would knock the DJIA down by more than 5,000 points from its current level of 23,000.

I remember that day well, in my broker’s office writing a check for a stock purchase that occurred the prior Thursday, and there was nothing a rational person could do but cut the check. Mike Binger had started his career just a few months earlier. Louis Rukeyser on the popular PBS show Wall Street Week told us, “It’s just money. The people who loved you last week still love you.”

The stock market recovered dramatically the following day, and finished up for the full year. It would be another two years before the DJIA reached its August, 1987 high. Importantly, the panic did not affect the economy or corporate earnings; no recession followed the crash.

Could the same thing happen again? This is a question that has been posed ever since that fateful day.

First of all, financial regulators have expanded oversight and controls, stepping in to stabilize markets in some situations. They have instituted “circuit-breaker” rules which require a stock or the overall market to stop trading temporarily when systems become overloaded with sell trade requests, restoring order.

Secondly, today’s technology has been proven to handle volume that is many times the size of volumes just a few years ago. Trades are made and confirmed in nano-seconds to at-home investors, not just institutional investors, making the process very efficient.

Other sudden one-day declines have occurred since 1987 in stocks as well as other asset classes, although minor by comparison and with little follow-through after the initial decline. Program trading has expanded dramatically, but most quantitative investors have factored liquidity, leverage and investment time horizons into their various metrics.

Much has been learned and a wide variety of economic, corporate and trading data is now at our fingertips. Active money managers can still be counted on to purchase bargains as stocks sell off.

To expand on these Market Reflections or to discuss any of our investment portfolios, please do not hesitate to reach out to us at 775-674-2222.

Posted on October 24, 2017 Read More

Third Quarter Market Review

This was another in a string of profitable quarters for investors. It marks the seventh consecutive quarter of positive returns in the U.S. stock market. Not only were stocks higher in the third quarter, but every major asset class also moved higher. Risk was rewarded in the quarter as more risk equated to higher returns. Emerging market stocks led the way, up 7.89% and U.S. Government Bonds generated a 0.38% return. Everything else in between from U.S. stocks, commodities, gold, and all other bond categories moved higher in the third quarter.

Despite tense political and social headlines, the financial markets are taking their cue from the economy. Strong corporate earnings, stable low interest rates, benign inflation and a confident consumer are leading markets to new record breaking highs on a weekly basis. Anticipation of meaningful personal and corporate tax reform in the U.S. is also supporting the markets. The fourth quarter will shed more light on the likelihood of tax reform in 2018.

Emerging markets and international developed stocks once again led the performance parade as investors found more compelling valuations in foreign stock markets. The Gradient Tactical Rotation Portfolio fully participated in this by investing exclusively in the emerging market momentum sector. U.S. stocks continue their “melt up” as other asset classes are comparatively unattractive. Interest rates are low causing bonds to have very limited upside. Low inflation eliminates any urgency to own commodities. Volatility is non-existent so there is currently no fear factor to own stocks. Strong corporate earnings growth makes stock ownership the best game in town.

The Federal Reserve left their key short-term interest rate unchanged at 1.00-1.25% after a 25 basis point hike in each of the first two quarters. The Fed’s next headline action will be the reduction of their inflated balance sheet by selling trillions of dollars of bonds they purchased during the multiple post financial crisis quantitative easing programs. This process will begin in the fourth quarter and will take years to unwind. Expect relative stability in bonds as rates remain low, but inch higher over time.

The 10-year U.S. Treasury Note finished the quarter with a 2.32% yield, down a few basis points since the beginning of the year. The yield curve has flattened this year as the short-term interest rates moved higher and longer-term interest rates are slightly lower. Credit spreads are locked in at the tightest levels of the year thanks to the strong equity market and a healthy risk appetite from investors. Investment grade spreads and high yield spreads remain very tight, helping these sectors outperform government bonds.

Stocks typically have two or three 5-10% corrections within a calendar year. This is normal and expected. This year, the stock market has yet to produce even one 5% correction. If we do finally get a correction in the fourth quarter, remember to use it as an opportunity to buy low. Do not throw in the towel on your financial plan the next time the market is down 5% from its new all-time high. Stay your course, stay invested.

MARKETS BY THE NUMBERS:

To expand on these Market Commentaries or to discuss any of our investment portfolios, please do not hesitate to reach out to us at 775-674-2222

Posted on October 2, 2017 Read More
Call Us: (775) 674-2222