Using Cash as Part of Your Strategy

Cash holdings, via savings accounts or money market instruments, are often ignored as part of a client’s investment strategy. To most investors, being “fully invested” means assets are allocated to risk-based investments (like bonds or stocks) in some fashion. In this market reflection, we will show why cash is a valuable asset and should be included as part of your overall investment strategy.

Cash as a strategic investment allocation

Cash, over an extended period, is generally a negative return investment due to loss of purchasing power. This is the reason we invest in assets that provide additional income through interest or dividend payments as well as principal growth through price appreciation. However, this doesn’t mean cash has no use in a client’s allocation. The main benefits of cash are:

  • Funding known expense needs: When investors have known upcoming expenses, especially for those under a year away, cash provides assurance that those needs can be met with little to no risk.
  • Insurance for unknown expense needs: While some expenses are seen beforehand, many expense needs can come as a surprise. Having a “buffer” of cash on hand provides value to pay for unforeseen expenses without severely altering the investment strategy.
  • “Dry Powder”: Once you have enough cash to cover known expenses, and provide some insurance for unknown expenses, there is still a valuable strategic reason for holding some cash on hand. Cash provides flexibility and liquidity to fund opportunistic investments. Having “dry powder” in cash allows investors to act in a prudent manner and take advantage of opportunities rather than panic selling at unfortunate times to meet their expense needs.

How much cash is appropriate?

When establishing an asset allocation strategy, what is the appropriate level of cash on hand? While this is an important question, the answer is very dependent upon an individual’s needs, goals and risk tolerance. Here are some things to consider when thinking about cash levels as part of your strategy:

  • Am I able to cover my upcoming expenses? Investors should consider cash as the primary vehicle to fund their short term needs (less than a year) and any known upcoming expenses. If investors are still generating income from work, this may provide some additional support, but everyone would benefit from a level of certainty that short term expenses can be met.
  • Do I have cash set aside for a rainy day? In addition to known expenses, do I have enough in cash to cover an unforeseen expense like a car repair or medical need? Investors want to ensure that they have some protection from life circumstances, and that these incidents don’t derail their long term plans or cause selling at inopportune times.
  • Am I holding too much cash? Conversely to holding cash to fund expenses, investors should not be holding cash in quantities that restrict them from earning their required rate of return. Remember, cash is a losing investment over time, and the safety of cash needs to be weighed against the loss of long term purchasing power. Investors need to build plans that incorporate safety AS WELL AS prudent risk taking to achieve their long term investment goals and objectives.

To expand on these Market Reflections or to discuss any of our investment portfolios, please do not hesitate to reach out to us at 775-674-2222.
Posted on January 30, 2018 Read More

Year End 2017

The fourth quarter was another celebration for bulls in a year to be remembered for strong returns and an extraordinary lack of market volatility. The proverbial “wall of worry” kept investor’s bullish emotions in check as news flow on health care, tax reform, political uncertainty and elevated market valuations kept investors cautious. The market largely shrugged off these fears, and asset classes rose based upon supportive fundamental growth and strong corporate earnings.

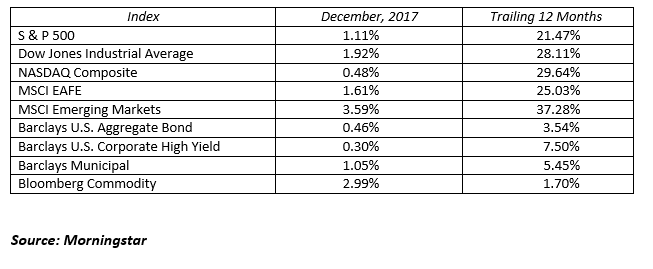
Performance for both the quarter and the year as a whole has been mostly positive across all asset classes. Economic growth, both in the U.S. and overseas, has been positive and accelerating. Jobs and wages have grown in the U.S. throughout 2017. Federal Reserve rate hikes have been measured and well communicated in the U.S., and monetary policy remains mostly supportive worldwide. Global interest rates have remained relatively low, and inflation has been controlled in most major markets. Tax reform that aims to significantly reduce the corporate tax rate has been signed into law. Lastly, corporate earnings grew at double digit rates in 2017, and expectations for continued growth have propelled markets across the globe.

Emerging market equities, as measured by the MSCI Emerging Market Index, earned its way to the top of the charts returning 37.2% for the year. International markets had a significant rebound after several years of under-performance. U.S. stock markets were strong again with growth stocks significantly outperforming value stocks. More amazing than the 21.5% annual return of the S&P 500 was the steady persistence of the market. In 2017 the Dow Jones Industrial Average achieved 71 record breaking closes with only 10 trading days where the market’s close changed by more than 1%.*

The bull market in bonds started over a generation ago in 1981. Technically, this bull market is still alive, but we have entered into an extended period of sideways price movement. Credit spreads (the premium paid to take on risk in bond markets) are near 10-year lows. Interest rates, while off their all-time troughs are still low by historical comparisons.

Looking ahead, what can investors expect for an encore performance? The economy is starting the year with great momentum as earnings growth continues. We forecast the economy continues to grow at a 3% rate as double digit earnings growth repeats itself in 2018 now that the tax bill is passed. While one needs to respect market momentum, it is also important to temper enthusiasm knowing we are nine years into a bull market and have not had even a 5% market correction in over a year.

This is likely a good time to reset your return expectations from 20% in stocks to 5%. Corporate fundamentals should remain strong in 2018 with earnings growth repeating at the 10%-15% level, in our opinion. Valuations, however, have been stretched to the point where the market is now trading at 20 times next year’s earnings. We forecast positive returns next year, but not a repeat of 2017. The bond market will likely have an instant replay year. The Federal Reserve will raise short-term interest rates two or three times, the yield curve continues to flatten, and credit spreads remain tight, in our opinion. Low single digit returns are the expectation here.

Stay invested with lower expectations. If you are compelled to lower the risk of your portfolio, do so with small asset allocation alternations. This is not the time to cash in, nor is it the time to go all in. Stay balanced at a risk level right for you.

Source: S&P Dow Jones Indices Market Commentary- DJIA Report Card 2017 (12/29/2017)

To expand on these Market Commentaries or to discuss any of our investment portfolios, please do not hesitate to reach out to us at 775-674-2222

Posted on January 5, 2018 Read More

2017 Year in Review: Follow the Fundamentals

2017 will be a year that will likely be remembered for strong returns and an extraordinary lack of market volatility. Despite the day-to-day news flow on health care, tax reform, political uncertainty, and elevated market valuations, investors largely shrugged off these concerns and asset classes rose based upon supportive fundamental growth and strong corporate earnings. In the last market reflection of 2017, we will discuss what we believe were some of the most important stories of the year.

1) Asset class returns were strong

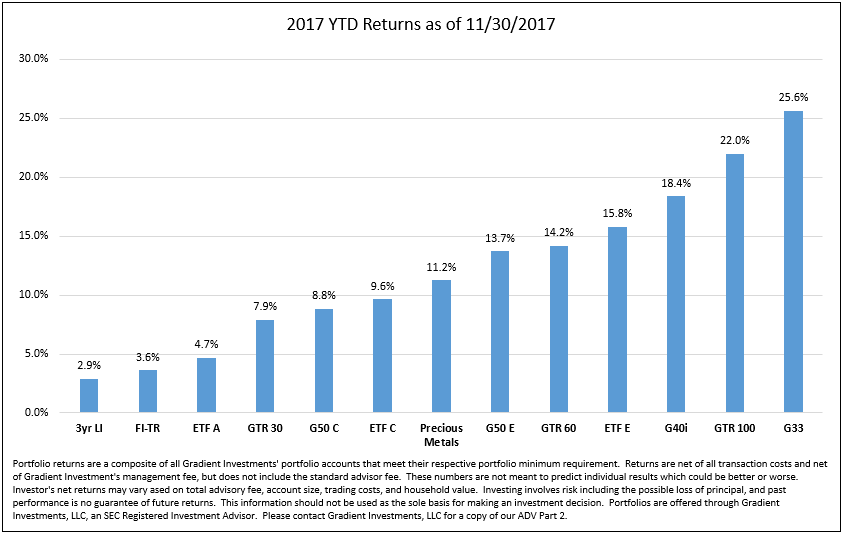
2017 performance has been mostly positive across asset classes. This performance was driven by several factors: GDP growth, both in the US and overseas, has been positive and accelerating. Jobs and wages have grown in the US throughout 2017. Federal Reserve rate hikes have been measured and well communicated in the US and monetary policy remains mostly stimulative outside the US. Global interest rates have remained relatively low and inflation has been controlled in most major markets. Tax reform that aims to significantly reduce the corporate tax rate has passed the House and Senate. Lastly, corporate earnings have grown at double digit rates in 2017 and expectations for continued growth have propelled markets across the globe. As a result, US stock markets were strong again in 2017 while international markets had a significant rebound after several years of underperformance. The below chart reflects performance of several of the Gradient investment portfolios across the risk spectrum. The data shows that investors had largely positive returns and were generally rewarded for taking risk in their investment allocations.

2) Volatility was historically low

By several different measurements, 2017 markets have had strong returns with extremely low volatility. Credit spreads, the premium paid to take on risk in bond markets, are near 10 year lows. The CBOE Volatility Index (VIX), a measurement of stock market volatility, is at levels that rank near the lowest in its history. Lastly, the below chart reflects annual returns (blue bar) and maximum drawdown (red dot) of the S&P 500. In 2017, the maximum intra-year decline has been 3%. This low level of decline is rare as it has only happened one other time in the past 25 years.

To expand on these Market Reflections or to discuss any of our investment portfolios, please do not hesitate to reach out to us at 775-674-2222.

Posted on December 22, 2017 Read More