Third Quarter Market Review

The third quarter is history and markets are standing tall despite warnings of seasonal weakness and further trade concerns.  U.S. stocks, led by the red hot growth sector, set two records this quarter.  This is now the longest running bull market ever and major indices achieved all-time record levels in September.  Growth has been an important factor as U.S. GDP growth hit 4.2% in the second quarter.  Supportive fiscal policy, confident consumers, strong corporate earnings and low interest rates may likely keep momentum positive through year end.

The Federal Reserve is sticking to their well-telegraphed game plan of gradually raising short-term interest rates 25 basis points per quarter. The September move marks the fourth consecutive quarterly rate hike bringing the targeted Fed funds rate to 2.00-2.25%.  The journey to a normalized monetary policy is underway as the Fed simultaneously tries to shrink their balance sheet while raising short-term interest rates.  The Fed needs to get all their tools back in the tool box before the next economic downturn hits.  So far so good, but they will need years to completely finish the job as the balance sheet reduction project is in its infancy.

Trade and trade agreements are still a hot potato for the markets.  Despite all the facts, tweets, and opinions, the market is taking much of this uncertainty in stride.  President Trump announced a preliminary agreement with Mexico to modernize NAFTA and the market applauded.  Even Canada joined at the very last minute.  China and the U.S. continue to up the tariff ante. While the end game is unknown, it appears ramping up the rhetoric and action is becoming less of a market negative.  A final trading agreement between the two economic powerhouses may well prove to be a future bullish catalyst for stocks.

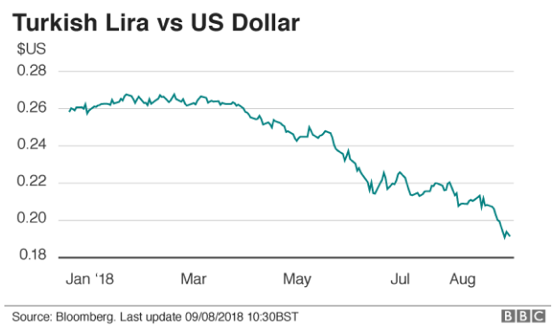
The strong U.S. dollar, along with trade tariffs, have taken their toll on the foreign markets.  To date, the U.S. stocks have fared much better than both international and emerging markets.  The Dow Jones Industrial Average was the lead dog in the third quarter gaining 9.63% while setting an all-time high.  The S&P 500 and the NASDAQ composite also had a strong quarter gaining 7.71% and 7.41% respectively.  The two major international indices (MSCI Emerging Markets and MSCI EAFE) were mixed for the quarter at -1.09% and +1.35% respectively.  Growth stocks are still outperforming value stocks around the globe.

The bond market is dealing with multiple cross currents, but the tide is taking interest rates marginally higher, causing prices to decline.  The benchmark 10-Year U.S. Treasury spent most of the quarter yielding just below three percent but ended the period yielding 3.05%, up 20 basis points in the quarter. The yield curve continued to flatten, as the 2-Year Treasury rose by 29 basis points to end the quarter yielding 2.81%, and the 30-Year Treasury rose 21 basis points to yield 3.19%.  Someday bonds will once again offer value.  Until then, own short duration bonds for liquidity and portfolio risk control.

Portfolio diversification is the most important tool to achieve your long-term financial goals.  We diversify to manage risk and protect against unwanted volatility.  Short-term market moves can entice investors to abandon a well-diversified approach at exactly the worst time.  The record rally into quarter end raises questions better left unasked.  Questions like, “why do I own bonds?”, “why do I have a cash position?”, “why do I own international stocks?”, and “why don’t I have all my money in Amazon and Apple?”  The correct answer is diversification.  Protecting your nest egg through diversification does not need an apology.  U.S. growth stocks are currently the best place to be, but leadership rotates over time.  The right asset allocation allows your portfolio to weather all storms and will keep you invested for the long haul.

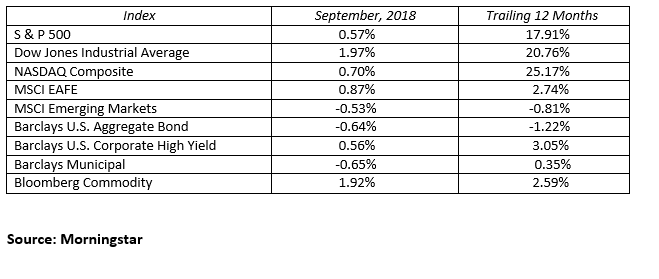
MARKETS BY THE NUMBERS:

To expand on these Market Commentaries or to discuss any of our investment portfolios, please do not hesitate to reach out to us at 775-674-2222

Posted on October 1, 2018 Read More

Value stocks as a driver of performance

We consistently discuss the benefits of “buying low and selling high”.  We are not alone in this regard as many successful investors, including Warren Buffett, tout the advantages of “value” investing.  While value is primarily defined as an investment trading below intrinsic value, there is significant debate about the proper way to measure value for a stock.  In addition, recent research suggests that valuation has little to do with short term future returns, but is very important for long term returns.

In regard to determining value, the price to book value metric has been a widely used valuation measurement.  Book value measures the amount of tangible assets on the balance sheet, and includes things like inventory, cash, and real estate.  Historically, a lower price relative to the book value per share indicates a value stock. Recently, there has been debate on how accurate book value represents stocks in an economy that is heavily reliant on services rather than tangible goods (such as the U.S. economy).  According to Barron’s, service oriented stocks have large percentages of their values in intangible assets like brand name, intellectual property, or customer loyalty.  These assets don’t show up on the balance sheet and would not be included in price to book value calculations.  Therefore, are we excluding investments as “value” stocks simply because the usual measurement system does not properly calculate their value?

With regard to valuation and the influence on future returns, analysis has shown that valuations don’t have a significant impact on returns in the short term, but have been shown to have a large impact on longer term returns.  The JPMorgan Guide to the Markets reflected this in the below charts.  On the left, you see that 1 year returns are relatively random across the valuation spectrum, but over 5 years (the chart on the right) returns are heavily influenced by how much you pay for the investment.

What this means for investors is that assessment of value is not a one-metric analysis.  Factors like price to earnings, cash flow, and the future outlook of the business are all worthwhile metrics to assess a stock’s value.  Second, in the short term, many different drivers can supersede valuations when it comes to returns.  However, as the time period expands, paying attention to company value and “buying low” and “selling high” tends to reward investors over time.

Sources:

  • The Reformed Broker
  • Pension Partners
  • Barron’s
  • JPM Guide to the Markets

To expand on these Market Reflections or to discuss any of our investment portfolios, please do not hesitate to reach out to us at 775-674-2222.

Posted on August 28, 2018 Read More

What’s Going on in Turkey?

The Turkish economy has been strong the past decade so one would inherently believe this is a positive for the country. But recently a combination of issues are pointing towards a potential economic crisis in the country. The economic growth in Turkey has been fueled by too much debt, which is causing:

  • Inflation levels above 15%
  • Rising interest rates; Turkish 10-year government bonds have a 20%+ yield
  • High trade deficits; they import more than they export

The overheated economy in Turkey has also resulted in a currency crash. The Turkish lira has collapsed versus the US dollar as investors are concerned about Turkey’s debt obligations (both government and corporate) to other countries. As the lira collapses, foreign debt becomes increasingly difficult to service and manage. See the chart below illustrating the weakness in the lira:

Also, relations between the US and Turkey are at a low point. Turkey has detained a US pastor accused of supporting a 2016 failed coup in against Turkish President Erdogan. In reaction, President Trump recently announced increasing sanctions and a doubling of tariffs on Turkish steel and aluminum.  This has added to the panic around Turkey, and the world watches and worries about contagion to other regions of the world, particularly The European financial markets.

But let’s put some perspective on Turkey’s economic crisis. On a macro scale, Turkish debt levels are smaller than what Greece was during their crisis several years ago. Outside of a handful of banks, there is not a lot of Turkish bond exposure in the global financial markets. Further, Turkey’s GDP is roughly only 6% of the Eurozone. Yes the Turkish stock market has fallen a lot, but it has become extremely cheap now possibly enticing investors. What global markets are really looking for is an internal Turkish economic plan to battle rising interest rates and inflation.

As of now, the crisis in Turkey is hurting emerging markets around the world, mostly due to US dollar strength versus global currencies. The GTR (EELV only has a 1% exposure to Turkey), G40i (no Turkish holdings), and Endowment (D and E) have international stock market exposure and have been negatively affected as a result. The crisis in Turkey could last awhile longer, but we feel the financial damage to international currency and stock markets has already occurred.

The MSCI EM Index is currently trading at 11.3 times forward earnings. This is a 26% discount to developed markets.  Based on price-to-book EM stocks look even cheaper. Following a nice 2017, returns in EM are weak in 2018 and we think hold value. There are still political and currency risks in emerging market investing, but for those with longer time horizons the risk/reward ratio looks favorable.

To expand on these Market Reflections or to discuss any of our investment portfolios, please do not hesitate to reach out to us at 775-674-2222.

Posted on August 15, 2018 Read More
Call Us: (775) 674-2222