Buy Low Sell High

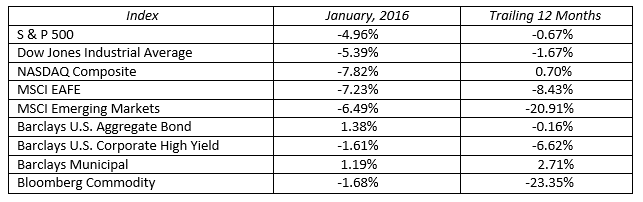
Last year left many investors frustrated. This year, frustration may turn to desperation. Fortunately, one month does not make a year. Just two years ago the stock markets began the year with similar price action. In January 2014 the S & P 500, the Dow Jones Industrial Average and the MSCI Emerging markets were down 3.6, 5.2 and 6.5 percent respectively. These indices finished that year at +13.7, +10.0 and -2.2 percent. This year started on a similar sour note as the same three indices declined 5.0, 5.4 and 6.5 percent in January. Where we finish 2016 is anyone’s guess at this early stage.

The January global market correction was rooted in news from China and the oil industry. The Chinese economy may be slowing at a faster rate than advertised and their U.S. linked currency is being aggressively devalued. This, plus oil prices reaching 13-year lows, stressed stocks, high yield bonds and commodity prices around the globe. January provided a gut check for even the most seasoned investors. There were few places to hide as even the darlings of 2015 were taken down.

One of my favorite Seinfeld episodes is where George comes to the realization that everything he does is wrong, so he commits to doing the exact opposite of his initial thought. George follows his own advice and everything turns to gold for him. Such is the struggle of the average investor. When the markets melt down, like it did in January, the initial reaction is to sell everything and go to cash. Unfortunately the opposite is usually the better answer. Buy low and sell high seems so simple until we allow emotions to decide our next action. When you feel close to veering off course, think opposite.

Thankfully, not everything was down. When stocks suffer investors usually flock to safety. This month was no exception as long U.S. Treasuries and gold were sought for their safe haven qualities. Yields on the 10 and 30-year U.S. Treasuries declined 33 and 26 basis points during the month sending their prices substantially higher. Even gold found a bid as prices rose by 4.8 percent for the month.

The bond market this year may act a lot like the bond market last year. Once again, everyone is expecting higher rates and multiple Fed tightening moves. The Fed believes they will hike the fed funds rate four times at one-quarter point each time. More likely will be the Fed monitoring data in the first half of the year and making one, possibly two twenty five basis point hikes in the second half. The yield on the ten-year Treasury may stay in the 2.0-2.5 percent range until real global economic growth emerges. Bonds are likely to be a boring asset class with low single digit returns. After this past month, a little boring might be just the right prescription for your portfolio.

Don’t expect miracles in 2016. Also do not expect eleven more months like January. The market will take a pause from the China and oil news to focus on fourth quarter corporate earnings. This may well be the catalyst for a much needed price reversal. U.S. stocks will face lighter headwinds in 2016. Stocks will benefit from continued low global interest rates, an eventual bottoming of oil prices, moderation of dollar strength, resilient consumers, and favorable earnings comparisons in the quarters ahead. Remember the goal is to buy low and sell high and resist the emotional pressure to sell low when times are tough. Investing is a marathon, not a sprint. Stay patient and invest for the long haul.

MARKETS BY NUMBERS:
Jan2016Market

Posted on February 2, 2016 Read More

Stocks, Oil and Volatility

Last week the S&P 500 had a positive week for the first time this year. The first two weeks were down significantly. Investors are concerned with the following issues:

  • Will the US economy go into recession (we think it will not)
  • Are corporate earnings growth at risk in 2016 (we think earnings will grow 5% yr/yr)
  • Will global growth continue to slow down (we think Europe/Japan is OK, emerging markets are not)
  • Will the Fed continue to raise rates (we think 1-2 increases in 2016 are more likely than 4)
  • When will the price of oil stop falling and begin to recover (we think prices gradually recover in 2016)
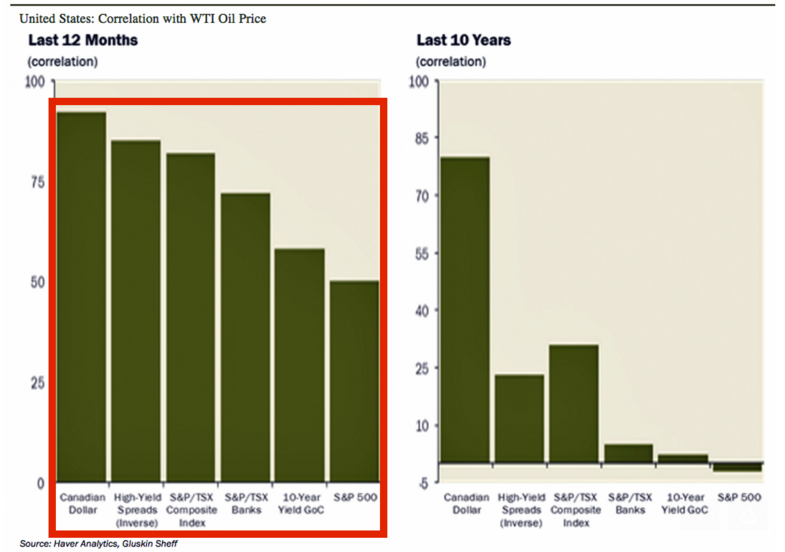
  • Of all these issues the price of oil seems to be the biggest driver of the investment markets right now. In fact the correlation of oil price moves to investment market moves has risen to all-time highs. See the chart below highlighting this effect. The chart on the left shows correlations to oil during the last 12 months and the chart on the right shows correlations the last 10 years:
    oil correlations_1
    What’s interesting is that U.S. stocks used to be negatively correlated to oil where now they are highly correlated to oil. And High Yield has moved from a small correlation to over an 80% correlation to oil price movements. Lower oil prices used to be considered a good thing for the economy, but not so much today, why?

  • Investors now see lower oil prices as an indicator that global energy demand (a proxy for global growth) is slowing down
  • Which increases concerns that deflation (not inflation) could derail the markets
  • Because of this, the decline in oil from $37 to $27 the first two weeks of January led to stocks declining sharply, and the subsequent recovery in oil this past week from $27 to $32 led to a nice rebound in stocks. It appears for the time being oil prices will be at the forefront of investor sentiment and we’ll be watching it closely.

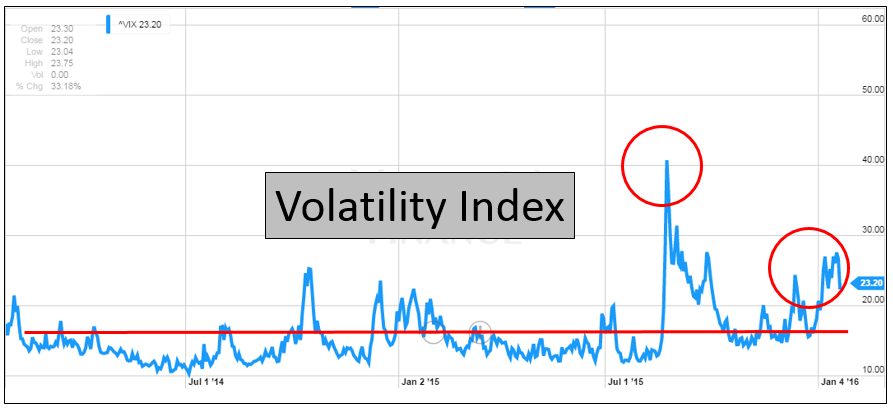
    As oil price movements become more volatile, we’d expect the stock market to become more volatile. This has been the case as the VIX chart below illustrates:
    VIX_2
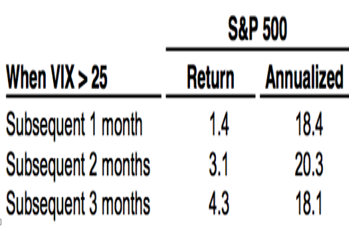
    The VIX is an indicator of market volatility and we can see that recently volatility has increased (red circles) above relatively lower levels of volatility (red line) we’ve experienced the last 2 years. One thing to keep in mind:
    vix25_3
    We are keeping a close eye on both the stock and oil markets. Market volatility has picked up, but we still believe our forecast of positive mid-single- digit returns is achievable.

    Posted on January 27, 2016 Read More

    China Pressures – A Not So Happy Start to the New Year

    Stock markets around the globe fell in the first few days of the new year, for the worst opening week ever. It started in the mainland Chinese stock markets and dragged down Europe and the US also. In the process, the S&P retraced all of its gains since the end of September. What was the cause for of all this?

    · Before the start of Monday’s trading a major indicator of Chinese economic growth, their manufacturing purchasing managers’ index, was reported below expectations and at the lowest level in three months.

    · Retail investors in China rushed to sell stocks, also in anticipation of the lifting of a ban on sales by major shareholders at the end of this week. Note that their market is highly volatile and dominated by a small group of local individuals, not professional traders.

    · New rules governing the closure of markets in the face of increased volatility further drove markets down.

    · The Chinese central bank cut interest rates in each day for eight days to stimulate borrowing, help drive economic growth, and stem the market decline.

    · All of these factors drove the value of the Chinese currency down.

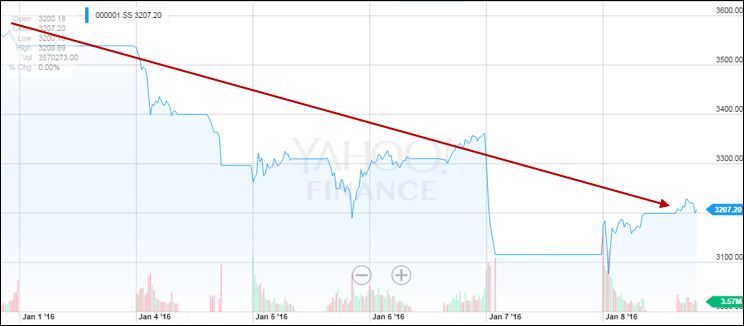
    · After four days, the Chinese stock index was down 21% from year end (see the chart below).
    Chinese Stock Market New Year 2016
    China appears to have been growing its economy in the 7-9% range for each of the last few years, well ahead of the vast majority of other countries. We think this has been moving, gradually, toward a 5-6% growth range over the next few years. This would be still positive and well ahead of other major countries. So a slowing in Chinese economic growth should not be a surprise.

    On the news, stocks sold off. The Chinese government worsened the sell-off with their new “circuit breakers” or the automated closing of stock markets triggered by a 7% change in stock values. In general, circuit breakers are designed to stabilize the markets by allowing for a cooling off period for frantic stock holders. The Chinese closed their markets twice on Monday and again early Wednesday, obviously not having their desired effect. We are now hearing reports that they have suspended circuit breakers indefinitely.

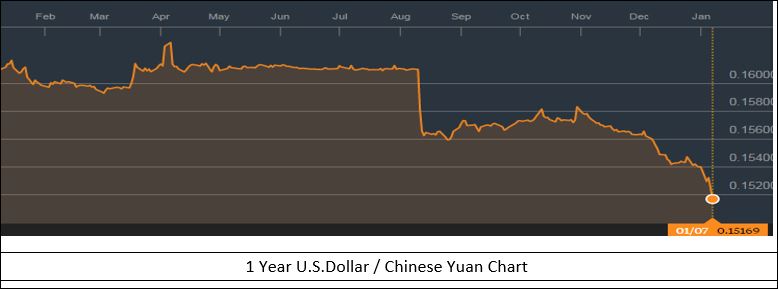
    With anxiety over slowing growth and increasing financial controls, the Chinese people are attempting to move their money out of the country. As the money flows out, their currency (the yuan) comes under pressure. Government actions last August and again in December were insufficient to support the yuan, so deflation becomes more likely. This also spooked the markets, and drove the value of the yuan to fresh five year lows. See the chart below.
    Chinese Yuan 1 year chart   1 8 16
    We believe the devaluation of the yuan will likely drive additional capital outflows in the coming weeks. As capital flees China where does the money go?

    Over the last few years we’ve seen it go into real estate in Canada, the US and other parts of the world. For those seeking more easily traded or “liquid” assets, US Treasuries are looking safe and attractive with roughly 2% yields. This compares to German bonds which yield about 0.50% and some other European government bond yields with negative yields. US dividend paying stocks are also looking attractive with an average 2% yield on the S&P 500.

    The concept of slowing Chinese growth is highly emotional and, in terms of impact on US companies, we believe it is somewhat isolated. US exports to China represent less than 1% of our economic output, while American multinational companies generate only 2% of their profits from China. But as a competitor, cheaper goods from China could prove to slow sales of US based companies to the rest of the world and push down prices.

    Of course China being China, their government also came in on the fifth trading day of the year to buy shares, providing support to the stock markets. European stocks finished the week down 6.5%, and the broad US market closed down 6%.

    We believe US markets remain attractive with S&P companies trading at a slight 10% premium to their ten year average forward price/earnings multiple, with 8-10% earnings growth estimated over the coming year.

    Posted on January 11, 2016 Read More

    News Archive