Acknowledging Market Corrections

The stock market has corrected approximately 10% from its May 2015 peak and volatility has increased. This is a correction, but hasn’t entered “bear market” territory (defined by a 20% decline).

Last week the Dow fell more than 500 points Friday, dropped another 1,000 points on Monday morning before finishing down 588 points for the day. Major stock markets across Europe and Asia also closed sharply lower, with risk assets (commodities, emerging markets, and high yield bonds) hit the hardest.

What’s behind the correction?

  • Evidence of a further deceleration in China’s economy
  • General concerns over global growth and collapsing inflation expectations
  • Chances of a Fed interest rate hike in September diminishing
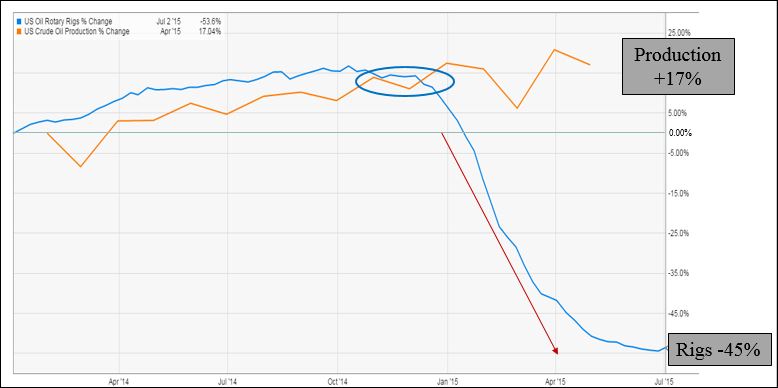
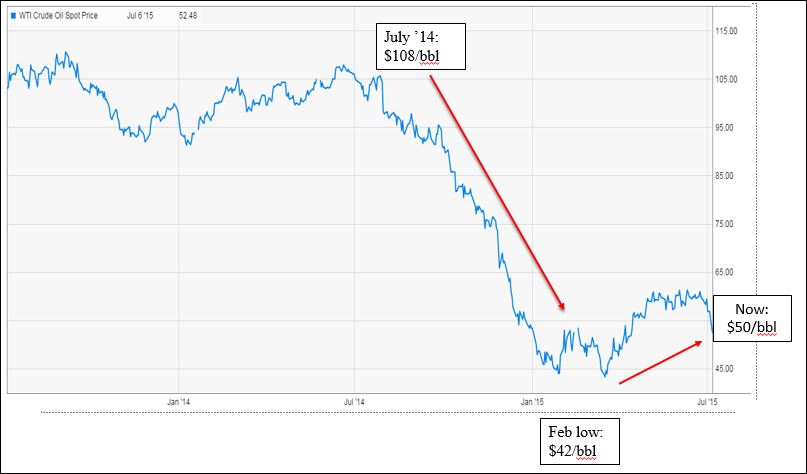
  • Falling oil/commodity prices, suspected to be caused by weakening demand


All of this sent investors scurrying for the safety of bonds and gold:

  • The yield on the US 10 year Treasury Note fell below 2.00%
  • Gold has begun to rise in price off its bottom


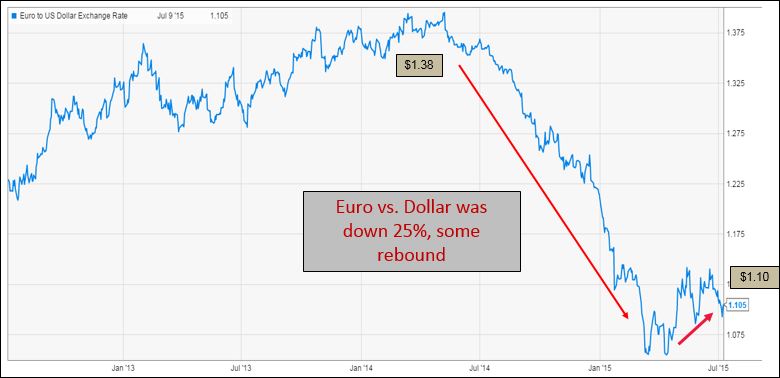
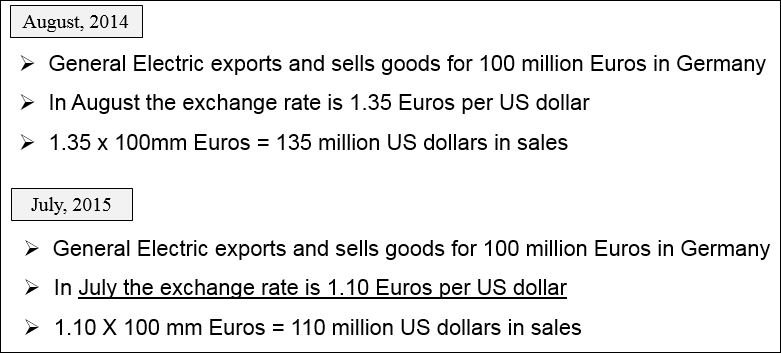
At the beginning of the year we forecast a flat market (+5%/- 5%) for 2015. We saw lower oil and a stronger dollar hurting corporate profit growth, along with a market that was a bit on the rich side, keeping stock prices in check for the year. As of today we don’t see any reason to deviate from this forecast.

Market corrections are tough and many may tend to panic. This is a good time to remember that big sell-offs occur all the time, even in years when the markets are up. The chart below highlights the fact that stocks don’t go up in a straight line:

corrections*
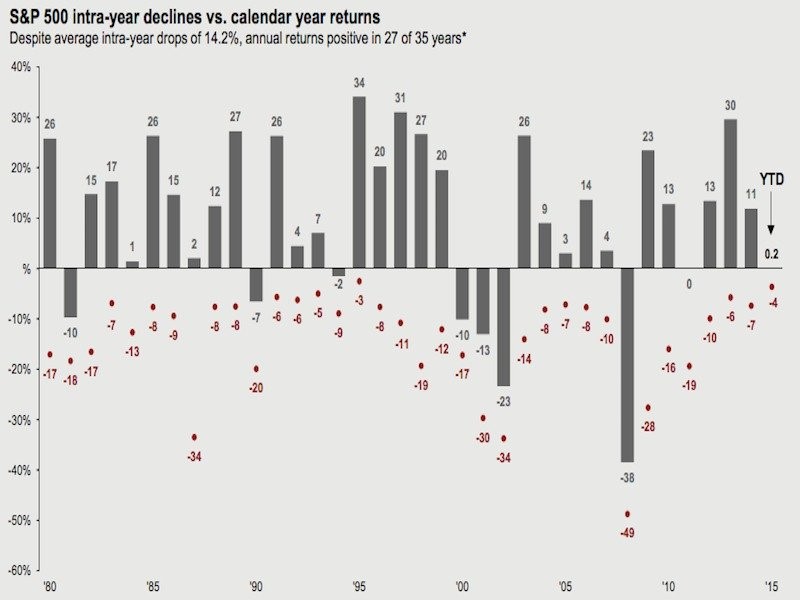
chart provided by JP Morgan Asset Management

The green bars are the annual returns for the year, and the red dots are the intra-year corrections from a peak to a trough that occurred during the year. This is a good chart to remind us that:

“Despite average intra-year drops of 14.2%, annual returns have been positive in 27 of 35 years”

What’s happening in the markets is stressful, but also routine. And while there could be more selling, historically the odds of that happening are actually low. Below are some statistics on market drawdowns/corrections provided by Josh Brown (the reformed broker). Since 1957 there have been:

  • 48 drawdowns from all-time highs of 5%
  • 17 of 48 became 10%
  • 9 of 48 became 20%+


Corrections normally occur every 12 to 16 months. The recent drop seems so sever because the market hasn’t fallen this much in four years. Here’s what we suggest during periods of extreme market volatility:

Remember your time horizon. Stocks are still up substantially since March 2009. You have to take the good with the bad. If you don’t need the money now, why worry about a one-week drop? Markets tend to eventually recover.

Remember why you own various asset classes. A diversified allocation of stocks, bonds and alternatives will buffer your individual portfolio returns in volatile markets.

Keep your perspective. The Dow lost 3.6% on Monday. On Black Monday in October 1987, the Dow lost 22%. Recent stock declines are big but not crashes, when viewed on a percentage basis.

Sell a little if you must. If you think we’re cascading into a bear market, take some money off the table. But don’t attempt to time the market and bail out of stocks completely. If you’re wrong, you’ll likely miss the rebound.

What now?

Volatile markets create opportunity and GI is assessing conditions that take advantage of those opportunities. In fact, we see reasons to be optimistic for those with the proper time horizons:

  • The economy is in much better shape than it was in 2008
  • In Europe, recent data suggests their economy is starting to grow again
  • High yield bonds are cheaper and default rates remain low
  • Stock are on sale. The S&P 500 price/earnings ratio is now 14.8X forward earnings, below its 25-year average of 15.7X
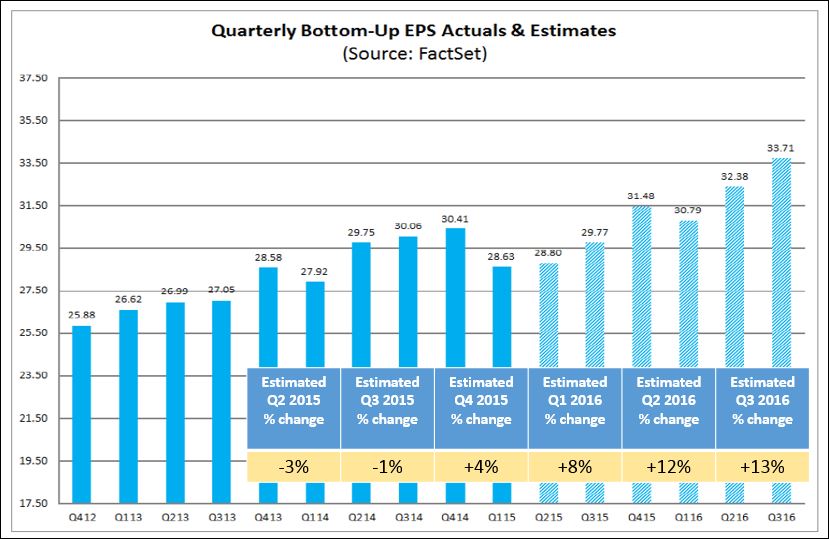
  • In 2016 corporate earnings are forecast to grow approximately 10% versus 2% this year


We will continue to monitor the US and global investment markets to assess the fundamentals versus our expectations. Remember, “despite all the corrections and bear markets over the past 50 years, investors have seen compounded returns of 6.6 percent, far in excess of the inflation rate of 3.6 percent” says Andy Rachleff of Stanford. If emotions get the better of us during corrections, this type of long term return will be difficult to achieve.

As of August 24th, 2015:

Dow Jones US Moderately Conservative Index is down 2.33% (TR) for the year

S&P 500 closed at 1,894 down 6.81% for the year

Russell 2000 closed at 1,111 down 7.00% for the year

U.S. 10 year Treasury Futures are yielding 2.06% down 11 basis points for the year

WTI Crude Oil futures closed at $38.24 down $15.47 for the year

Gold closed at $1,152 per ounce down $31 for the year

To expand on these market reflections or discuss other portfolio strategies please don’t hesitate to reach out to us at 775-674-2222.

Posted on August 25, 2015 Read More

Waiting Game

Investing requires patience. Investors usually desire instant gratification on their portfolio decisions, but the market moves on its own timetable. The markets are currently supplying the bulls and bears with ammunition for their cause, and investor patience is being tested every day. The bears are waiting for an elusive ten percent price correction, while the bulls are waiting for stronger global economic growth and meaningful top line corporate revenue growth.

The waiting game is playing out in multiple markets. In the U.S. stock market, we wait for quarterly corporate earnings to justify current stock market valuations. So far, overall second quarter corporate earnings have been positive, but the market has clearly delineated the winners from the losers based on company specific results. The breath of the U.S. is very thin with a handful of stocks supporting the overall market. In the international stock markets, we wait and watch the news from Greece, Europe and China to see how these issues will resolve themselves. In the commodities markets, the story is a strong dollar and declining commodity prices. We wait to see if gold and oil will bottom here or continue their downtrend. We question how strong the dollar will become in this strengthening cycle.

In the U.S. fixed income markets, the Federal Reserve is stringing the markets along regarding the timing of a 25 basis point fed funds rate hike. This year and a half debate continues and investors now speculate whether the inevitable happens in September, December or early 2016. December seems most likely to me, but this well-telegraphed move will be a nonevent. Remember the market is fretting about a move from zero to 0.25 percent after spending six years at zero. More interesting will be what the Fed reveals in the first meeting following the eventual rate hike.

In the first month of the third quarter, results in the stock markets were generally positive with the exception of the emerging markets which fell 6.93 percent. A slowdown in China and concerns about Greece’s financial survival and continued inclusion in the European Union sent shock waves through the emerging markets. The U.S and international developed stock markets were able to reverse the small losses incurred in June. Commodities continued to get pounded as oil prices slipped back into the forty dollar range and gold hit new recent lows. The broad Bloomberg commodity index fell 10.63 percent in July alone.

The U.S. bond market enjoyed a positive month as interest rates declined for bonds that have five years or more to maturity, causing the yield curve to flatten. This is a reversal as compared to recent months where longer term rates rose and the yield curve steepened. The short end of the yield curve increased one to six basis points, and longer maturity rates moved marginally lower. The 10-year U.S. Treasury declined 15 basis points to yield 2.20 percent, and the 30-year was down 19 basis point to yield 2.92 percent.

Flat markets test patience. The sideways action in the financial markets over the past few months can wear on investor confidence. Successful long-term investors have clear goals and objectives, remain focused on their long-term goals and exercise patience during the journey. Realistic return expectations plus appropriate time horizons and patience equals success. The remainder of 2015 will continue to test investor patience. In 2016, the year-over-year comparisons will become more market friendly as the strong dollar and oil price decline will have been over a year in the making.

MARKET BY THE NUMBERS:

august 5th

Posted on August 5, 2015 Read More

Headwinds Becoming Tailwinds: Earnings Growth is Forecast to Accelerate

Consensus earnings for the S&P 500 are expected to decline 3% for the quarter ended June, the largest decline since the third quarter of 2009 when earnings were down 16%.

Within that 3% fall, there is a wide range of growth expectations for the quarter depending on the dynamics of each sector and sub-sector. Biotech earnings are expected to rise by 23% while integrated oil and gas companies’ earnings are projected to tumble by 51%. If we exclude the energy sector, corporate earnings are projected to rise 2%.

Earnings at energy-related companies are being socked by the 54% plunge in oil prices since their peak in July of last year. With the oil price drop, U.S. oil drilling has been cut back dramatically as seen in the rig and production chart below.

Market Reflection Rigs and Production 7 15_1

Oil production cannot be turned off like a faucet. Despite lower prices US production is still on the upswing, and inventories are near their 80-year seasonal peak. However, expectations are for volume declines beginning in the coming months, and oil prices are expected to remain around current levels or improve modestly, having already reach their lows in February. See the oil price chart below.

Market Reflecton Oil Prices_7-15_2

With major cost reductions in place and the steep drop in oil prices behind us, we anticipate that upcoming oil production drops would produce a tailwind to energy companies’ earnings over the coming quarters.

US-based global companies are being impacted by the strength of the US dollar versus foreign currencies over the past year. See chart below, noting the decline of the value of the Euro.

Market Reflection Euro Dollar 7 15_3

As US-based companies sell their products overseas, sales are impacted by the strength of our dollar. Locally sourced products & services appear more attractively priced to customers abroad when our dollar has increased in value. Most companies hedge their earnings, so the impact to earnings is not as severe as the sales impact, but both the sales and earnings growth trends can certainly be interrupted by these macro-economic conditions. The following example may clarify this.

Market Reflection GE Example Euros 7 15_4

The end result of such a scenario is that General Electric would record a 25 million year-over-year decline in US dollar sales.

The majority of this unprecedented broad-based currency re-valuation occurred in the second half of 2014. While further strengthening of the dollar is not out of the question, we expect overseas currencies to begin to show improvement, year-over-year, in the second half of 2016. This is due to efforts by overseas central banks to stimulate their economies. Imitating the success of the US Federal Reserve, the central banks of 22 other countries are currently in an easing mode. We expect them to show varying amounts of success based on factors specific to each country. In general, however, we anticipate that the US dollar will most likely stabilize, providing a tailwind to earnings for US multinational companies.

With these headwinds turning into tailwinds, consensus earnings estimates for the S&P 500 in the coming quarters are on the rise, from down 3% in the June ’15 quarter to down 1% in the September quarter to up 12-13% beginning in mid-2016. See chart below.

Market Reflection Pfd Bottom Up July 15_5

Current valuation for the S&P 500 stocks as measured by price/earnings is fair in our view. At 16.5 times forward earnings, they are above their 10-year average and toward the top end of the range, but nowhere near the peaks reached during the internet bubble of 2001-2002. We could get some multiple expansion as earnings growth accelerates. However, we would be more positive on any pullback in the market.


Posted on July 20, 2015 Read More

News Archive

Call Us: (775) 674-2222