The third quarter began in bullish fashion as the most of the major stock benchmarks jumped by 1.5% or more in the first week of July. A key catalyst for this quick start was the Department of Labor’s June jobs report that said the U.S. economy added 224,000 net new jobs, 60,000 more jobs than most forecasts predicted. The headline jobless rated moved 0.1% higher to 3.7% in June, but the employment numbers remain strong across the board and are keeping consumers in good shape.
Retail sales reported in July for June’s activity were up 0.4%, which exceeded expectations. This is meaningful as consumer purchases represent two-thirds of our Gross Domestic Product (GDP). The second quarter delivered 2.1% GDP growth, slightly above the 2.0% expectation. While this is weakest print in over two years, the decline was mainly a result of a decrease in business investment. Consumer spending increased 4.3% and government spending jumped 5.0%.
On the last trading day of the month the stock market gave back some of the first week’s strong gains. Through previous statements and testimony, the Federal Reserve chairman had opened the door to future interest rate cuts. The economic sluggishness elsewhere around the globe has caused the Fed to rethink their current fed funds rate target. In the final trading hours of July, the Federal Reserve announced their first interest rate cut in over ten years. The 25 basis point cut along with post decision comments by Chairman Powell disappointed market expectations causing a one day stock price correction. Now all eyes turn to the employment numbers to be released on August 2nd.
The recipe for this strong economy includes more people employed, consumers willing and able to spend, and corporations’ ability to earn money and grow profits. July 15th marked the beginning of another round of quarterly corporate earnings announcements. More will be known by mid-August, but the early news looks positive on the corporate earnings front as 77% of those reporting have exceeded expectations. As is the case each quarter, there are individual companies that exceed expectations and those that fall short. On the positive side, money center banks had a good quarter, some technology companies like Alphabet, Intel and Twitter exceeded forecasts while Amazon, Caterpillar and some of the smaller airlines disappointed. Consumer favorites like McDonalds, Costco, Starbucks and Coca-Cola found their way to new 52-week high stock prices on very strong quarterly results.
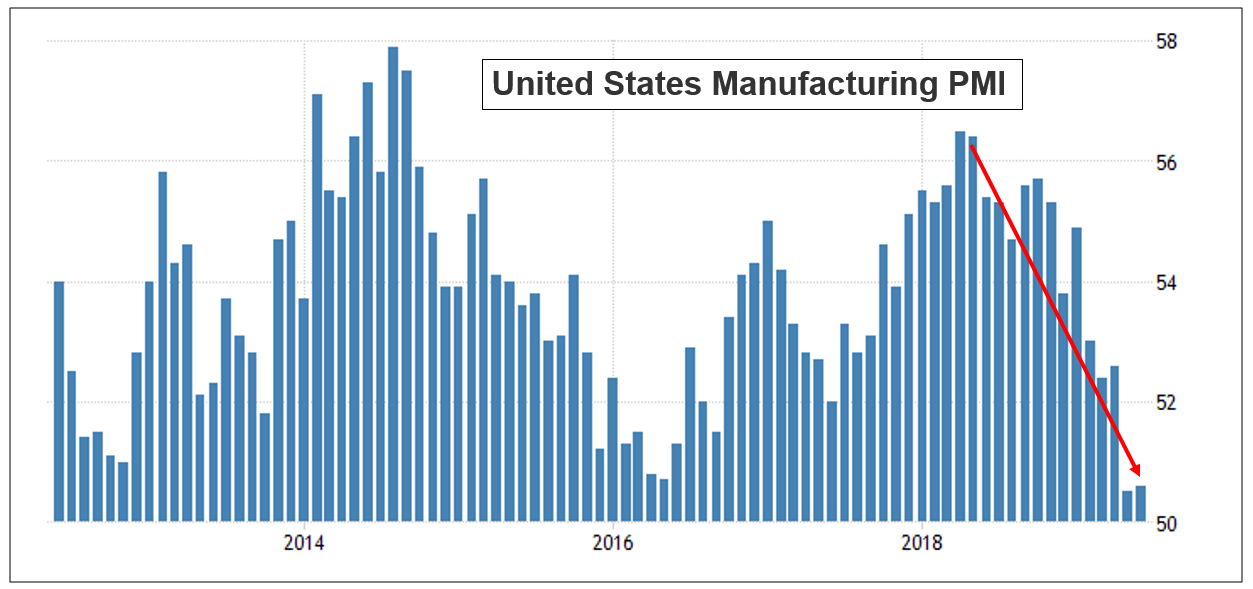
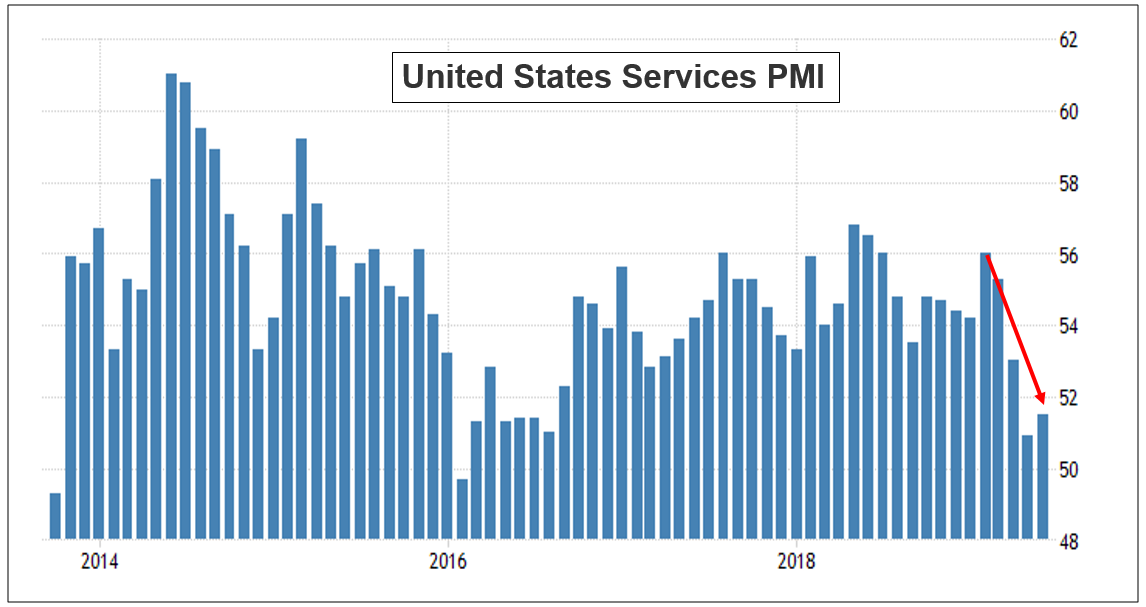
While background noise can be distracting, it is important to identify and understand the signal in the headlines. Tariffs are likely here to stay for the foreseeable future, yet the markets continue to react to the latest threats and realities. Tariffs on Mexican imports appear to be off the table for now. After the June G20 meeting, China is back to the negotiating table, but they seem content to be very deliberate with their discussions and may wait it out until the next election cycle. France may be the next tariff target as they plan to institute a new digital tax on certain U.S. technology firms.
Be aware of your total surroundings but remain keenly focused on the U.S. consumer and corporate profits as those tend to be better indicators of long-term economic health.
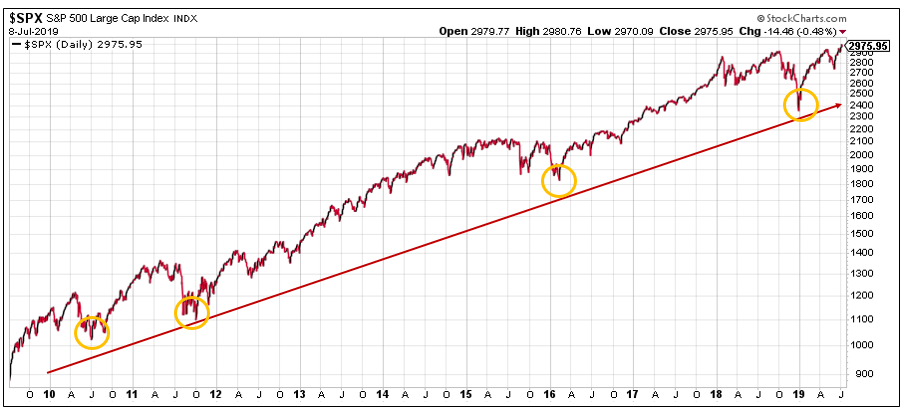
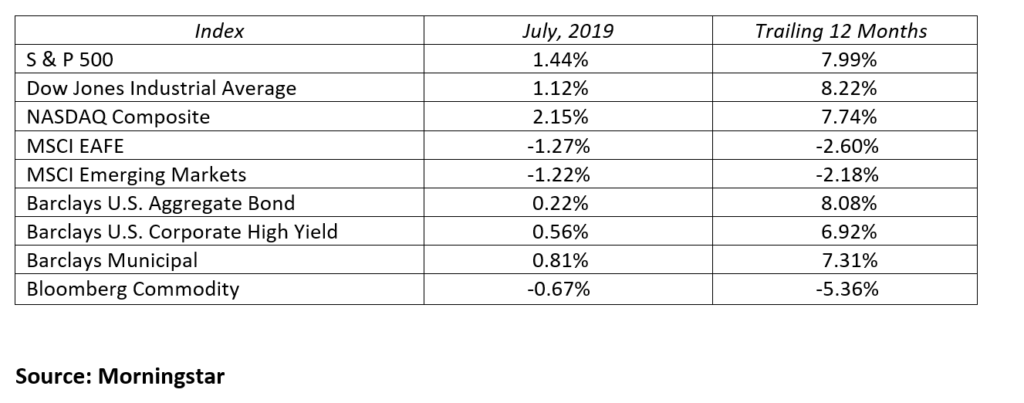
U.S. stocks have once again found their way to higher highs. The S&P 500 cracked the 3,000 level and the Dow Jones Industrial saw 27,000 for the first time this month. The strong economy, low interest rates, benign inflation, corporate earnings growth and an accommodative Fed have set the stage for this remarkable run in the financial markets. The Dow Jones Industrial Average, NASDAQ Composite, S&P 500 and the gained 1.12%, 2.15%, and 1.44% respectively in July. International stocks continued to lag the U.S. as the MSCI EFAE and emerging markets indices declined -1.27% and -1.22% respectively.
Bond performance is exceeding all expectations at this point in the year and looks likely to hold from here. Low inflation and continued moderate growth should keep interest rates in a tight trading range. This month interest rates ticked up slightly after a strong rally into mid-year. The 2-Year Treasury note yield rose 14 basis points to end July yielding 1.89%. With the fed funds rate now pegged at 2.25%, it’s obvious the market is still calling for another future Fed rate cut. Yields also increased marginally on both 10-year and 30-Year Treasury securities bringing their yield to 2.02% and 2.53% respectively.
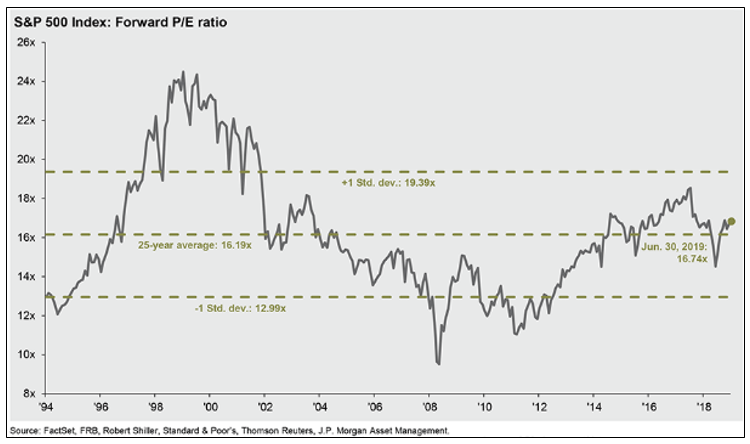
We would encourage investors and advisers alike to concentrate on asset allocation and portfolio rebalancing and less on absolute market levels and emotions. Yes, it is true the U.S. stock markets are trading near all-time highs and interest rates remain stubbornly low. This statement was true a year ago and may still be true a year from now, we just don’t know. Instead of falling victim to the next bearish viewpoint you read or hear, take this opportunity to rebalance your portfolio back to your targeted risk tolerance. For example, if three years ago it was determined that 60% stocks and 40% bonds was the asset allocation best suited for your situation and asset appreciation now has your portfolio at 66% stocks and 34% bonds – it’s time to rebalance. Use this strong market as an opportunity to reduce stocks by 6% and add 6% to bonds, thus returning your portfolio to the original 60/40 allocation target.
Also, it is important to avoid the temptation to “go to cash” when you read the next well-written “end of the world” piece. Investing is a marathon, not a sprint. Enjoy the run, breathe, and stay invested at a risk tolerance appropriate for your situation.
MARKETS BY THE NUMBERS:
To expand on these Market Commentaries or to discuss any of our investment portfolios, please do not hesitate to reach out to us at 775-674-2222