Residential home construction and transaction activity are very important components of the US economy. To gauge the health of the housing market, various sources provide data that give us a glimpse of construction activity, home sales, pricing trend analysis, and the direction of stock prices for companies reliant upon housing.
Housing Starts
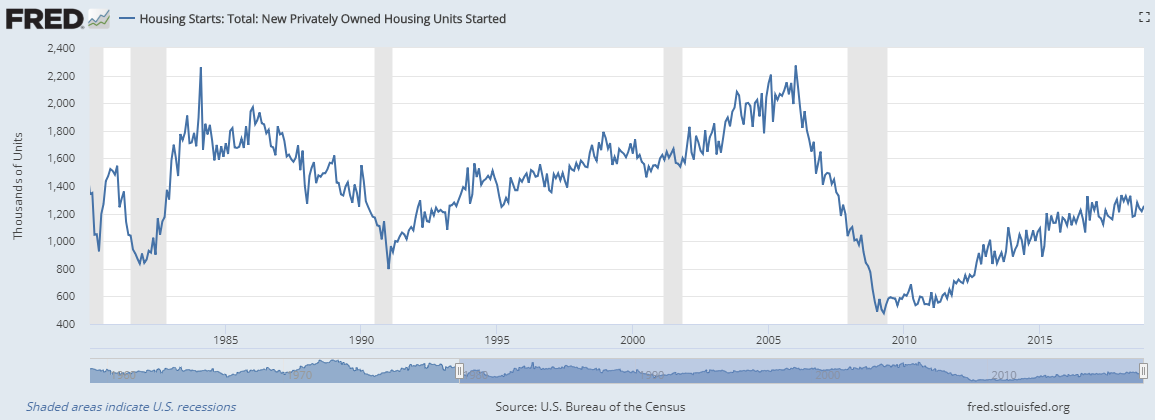
Housing start data is provided monthly by the US census bureau and reflect the number of home units that were started at the beginning of each month. The chart below reflects the housing start data since 1980. Housing starts have largely been rising since hitting a bottom in April of 2009, but the pace of starts has been at much lower levels than prior expansion times in the 1980’s, 1990’s, and early 2000’s. In fact, a recent Bloomberg article suggested that our current rate of starts is below the level of the 1960’s, when the US population was less than 60 percent of what it is today.* The latest data has been delayed due to the government shutdown, but the last reported data reflected a slowing construction market as November 2018 starts were 3.6% below the level in the prior year.
Pending Home Sales Index
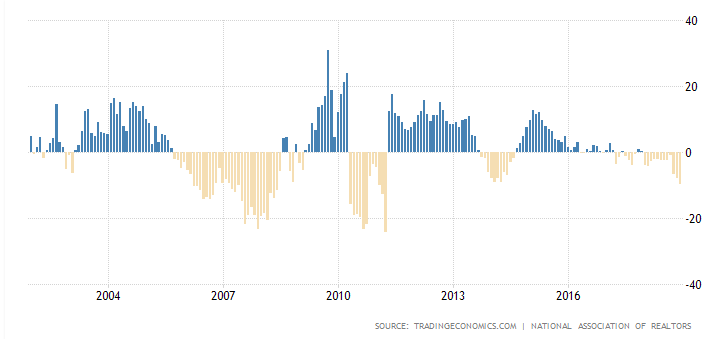
The National Association of Realtors provides a monthly index that measures signed contracts for home sales. The chart below reflects the year-over-year growth rates of the pending home sales from 2002 to December 2018. In the most recent month, sales declined, reflecting a slowing in transaction activity in the housing market. According to CNBC, the pending home sales data from December 2018 marks 12 straight months of declines and the lowest December sales reading since 2013.**
United States Pending Home Sales – Year over Year Percent Change
S&P CoreLogic Case-Shiller US National Home Price Index
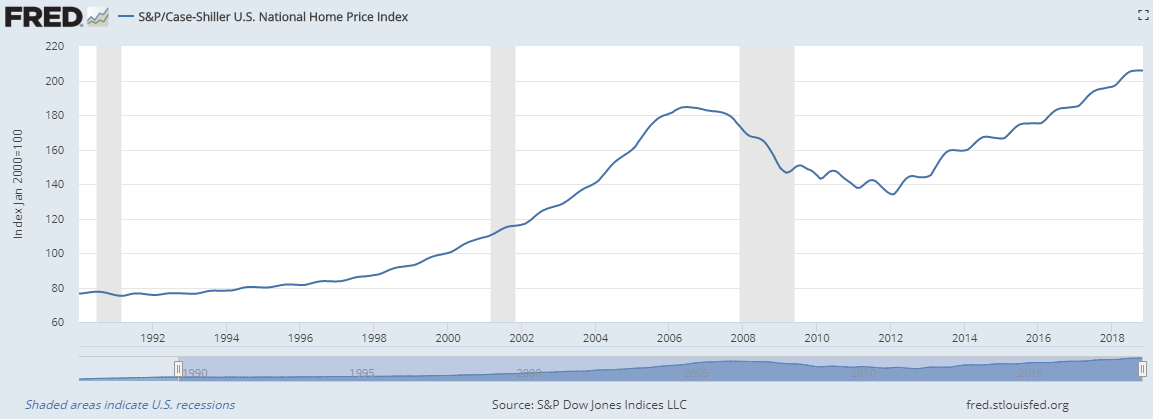
S&P Dow Jones Indices provides monthly data that reflects national pricing trends for the residential real estate market. The below chart shows data from 1990 to November 2018. The information shows that prices have been steadily rising since bottoming in April 2012 but recent data (August to November 2018) shows more of a flattening pricing environment, where price increases slowed to 5.2% year over year.
Housing-related stocks
Another indicator of the housing market is the stock performance of companies that are tied to housing and home improvement. Two exchange traded funds, iShares US Home Construction (ITB) and SPDR S&P Homebuilder (XHB), provide a broad look into the performance of housing related stocks. The chart below reflects that housing stocks (ITB: Black line, XHB: Blue line) have generally underperformed the S&P 500 (IVV: Red line) over the last year. However, year to date performance of the homebuilder stocks have rebounded to a greater degree than the overall market, suggesting sentiment is shifting toward more favorable housing conditions in the future.
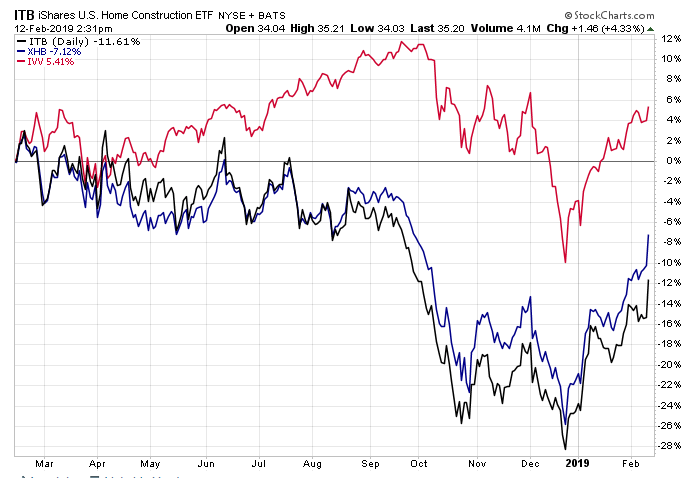
As the data shows, the housing market was soft in 2018. Transactions and housing builds were largely flat to down year over year, prices began to flatten, and housing related stocks underperformed the market. As we begin 2019, there has been a sentiment shift in housing stocks. For this trend to continue, the market will need to see stabilization and future growth of the data that measures housing related activity.
* Bloomberg 2-11-19
**CNBC 1-30-19
To expand on these Market Reflections or to discuss any of our investment portfolios, please do not hesitate to reach out to us at 775-674-2222.