VOLATILITY: IT’S BACK

The long awaited market correction became a February reality as stock prices fell 10% from their January highs, quickly unnerving investors. This move lower was expected and long overdue. Actually it was the first down February since the infamous February, 2009. The correction came swiftly as volatility spiked and values evaporated in the blink of an eye. Maybe mom was right and it is less painful just to rip the band aid off versus peeling it back slowly. Regardless, a 10% correction still stings.

The silver lining in this dark cloud was the immediate 5% bounce back in stock prices. Investors barely had the opportunity to assess the damage of the original 10% sell off. By the end of the month, some of the initial correction had been reversed but the markets were still under water. What lessons can we take away as we begin our journey through 2018?

Corrections are normal. In an average calendar year, one would expect the stock market to have three price corrections in the 5-10% range. The fact the market went for two years without a meaningful correction is the exception, not the rule.

Don’t let sudden price changes take you off your game. Volatility is likely to remain elevated in the months ahead. While we are sticking with our mid-single digit return expectations from stocks this year, it may come with more intra period price movements than last year. Economic growth is strong, corporate profits are rising and the new tax bill should provide a tailwind. Still, the market will need to come to grips with higher interest rates, risk of higher inflation and corporate earnings variability as we learn the impact of the new tax law.

Allow yourself to think like a contrarian. Last month, we discussed the concept of rebalancing portfolios during periods of extreme market strength or weakness. It’s okay to buy low and sell high. If markets revisit recent highs consider a portfolio rebalance to reduce risk. If markets retest recent lows or make new ones, think buying opportunity.

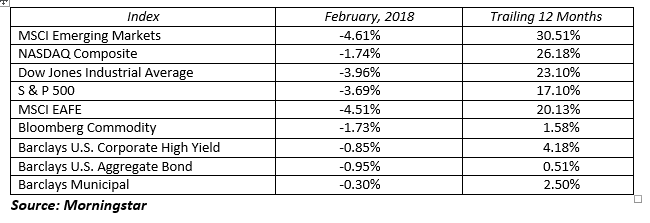
Obviously February was a rocky month. The benchmark S&P 500 was down 3.7% for the month to close at 2,713.83. This still leaves the benchmark positive for the year with a 1.8% year-to-date return. With earning’s season in full swing, the fact that many companies reported revenues and earnings which beat consensus estimates is helping to stabilize the market. A record high number of S&P companies issued positive EPS guidance for this year, raising the 2018 consensus estimate by 7% just since the start of the year. These results are driven in part by the decrease in the corporate tax rate for the year based on the U.S. tax reform legislation. An improving global economy and a weaker U.S. dollar are other factors supporting stronger profits from U.S. corporations.

International and emerging market stocks were not immune to the global market volatility. These two broad sectors also posted negative returns for the month, down 4.5% and 4.6% respectively, but hanging on to year-to date gains of 0.3% and 3.3%.

Bond prices declined as interest rates rose, with the benchmark 10-Year U.S. Treasuries now yielding 2.87%, up 47 basis points in just two short months. The yield curve steepened slightly during the interest rate rise in February. The 2-Year Treasury rose by 11 basis points to finish February at 2.25% while at the long end, the 30-Year Treasury rose 18 basis points to end the month at 3.13%. With the economy gaining momentum, there is a very high probability the Federal Reserve will raise the Fed Funds rate by 25 basis point at their March meeting.

The financial road will be bumpy at times. The market is digesting transitory data related to new signs of wage inflation, higher interest rates, the unwinding of central bank monetary accommodations and a Federal Reserve under new leadership with Chairman Powell. On the other hand, fundamentals are still very positive. Consumer confidence is soaring, home prices are steady, unemployment is low, lower taxes are just beginning and corporate profits should experience double digit growth again this year. While the headlines are designed to scare you into reading, watching, or trading take comfort in the fact the economy is strong and long-term investors with a plan will be rewarded for accepting and properly managing risk.

MARKETS BY THE NUMBERS: 
To expand on these Market Commentaries or to discuss any of our investment portfolios, please do not hesitate to reach out to us at 775-674-2222
Posted on March 2, 2018 Read More

Individual Bonds versus Bond ETFs

At Nevada Retirement Planners, we primarily use exchange traded funds (ETFs) for our bond allocations. In the past, we have been asked why we don’t use individual bond holdings instead of ETFs. In the below reflection, I will provide our justification for using ETFs instead of individual bonds for investor’s fixed income allocations.

Primary Reasons for using bond ETFs 

  1. Diversification
  2. Liquidity
  3. Cost

Bond ETFs provide diversification which reduces individual issuer credit risk. For example, we use the SPDR Aggregate Bond ETF (Ticker: SPAB) in our portfolios. SPAB has over 4,000 bond holdings. Individual investors, who may have only a few bonds in their portfolio, would be subject to greater risk of credit events (such as defaults) that can have a negative impact on portfolio returns.

Second, because of their significant daily trading volume, bond ETFs tend to provide greater liquidity compared to individual bonds. Finding a counterparty to purchase a small allocation of an individual bond may be difficult, or may be at prices that are significantly lower than stated value, especially when attempting to sell these assets.

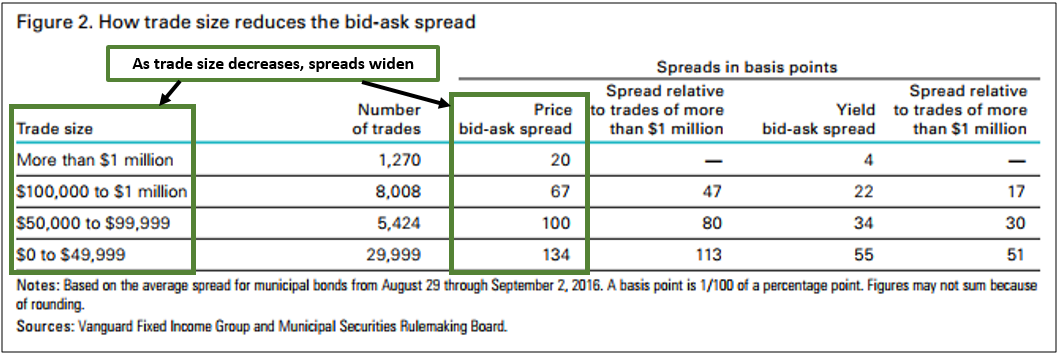
Third, bond ETFs provide diversification and liquidity at relatively low cost. With the above example, SPAB trades an average of 926,000 shares per day (source: Yahoo Finance) and charges a 0.04% expense fee. The reason that comparative costs of transacting in individual bonds can be higher over time is due to wider bid-ask spreads. The below data from a Vanguard study reflect this cost, where transaction spreads (the price to buy versus the price to sell) are wider, or more costly, as the aggregate purchase size gets smaller.

Individual bonds versus bond ETFs in rising rate environments

A common discussion point for holding individual bonds over bond etfs is that individual bonds have less risk in rising rate environments. This is based on the fixed maturity as opposed to bond ETFs that do not mature. While this is functionally true that bond ETFs do not mature, for most investors, fixed maturity does not tend to actually provide added value.

The reason is that most investors tend to reinvest proceeds from bond coupon and principal payments. Because bond coupon payments are typically not enough to repurchase another bond, there can be a “cash drag” as assets are held in lower returning cash/money market accounts until there is enough to purchase an additional bond. In regard to principal reinvestments, individual bond investors do not have the “cash drag” issue, but as we discussed prior, transaction costs for purchasing relatively small amounts of a bond tends to be higher and will also likely act as a drag to long term portfolio returns.

Lastly, remember that bond ETFs are simply a collection of individual bonds. They have a variety of holdings that are maturing at various times and are reinvesting proceeds regularly. In rising rate environments, those reinvestments will be done at higher rates and average portfolio yield will likely increase. In addition, bond ETFs have the advantage of better pricing and less credit concentration risk compared to individual bond holders. Also, the ability for investors to reinvest their coupon proceeds back into ETFs allow for less “cash drag” in portfolios.

In summary, we feel that allocations to bond ETFs for most retail investors is the preferred method. The advantages of diversification and liquidity more than offset the added expense fee. We actively manage our bond ETF investments to ensure we are providing allocations that are based on our stated investment purpose while continually evaluating products to enhance returns and/or reduce costs.

To expand on these Market Reflections or to discuss any of our investment portfolios, please do not hesitate to reach out to us at 775-674-2222.

Sources:
Wall Street Journal – https://www.wsj.com/articles/five-myths-of-bond-investing-1393024811
Vanguard- https://personal.vanguard.com/pdf/ICRIBI.pdf
Northern Trust – https://www.northerntrust.com/docum…y/maturity-bond-funds-vs-individual-bonds.pdf

Posted on February 23, 2018 Read More

Corrections, Interest Rates, and Inflation

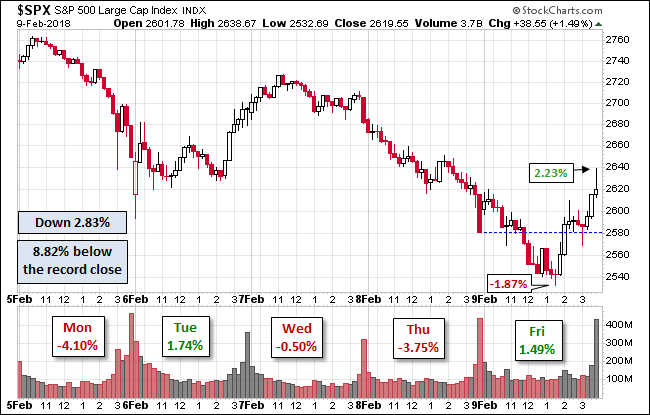
The US stock market had a correction in early February after starting the year with strong price returns in January. A correction is defined as a fall of 10% from recent highs and the chart below illustrates the past week’s volatile performance in the market:

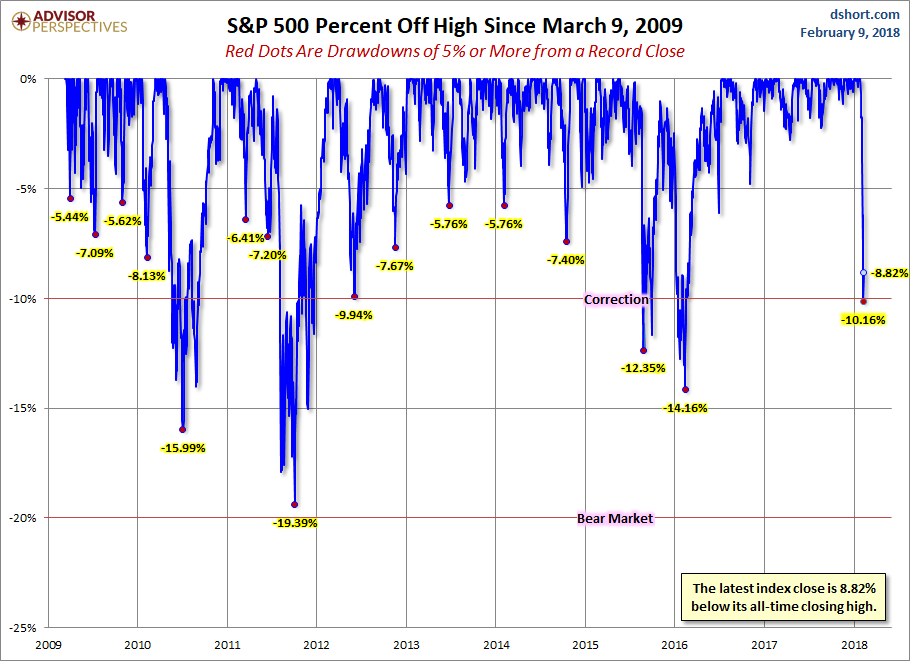
We’ve often discussed that market corrections are normal, that we should expect them, and attempt to use them opportunistically. The chart below illustrates the frequency of market pullbacks since 2009:

Note that there has been 16 corrections greater than 5% since the latest bull market started in 2009. But what triggered the latest correction? Was it the parabolic melt up stocks had in December and January? That could be part of it, but most investment strategists appear to be blaming:

  • A sharp rise in market interest rates
  • The fear that inflation is starting to creep into the economy

Let’s discuss both.

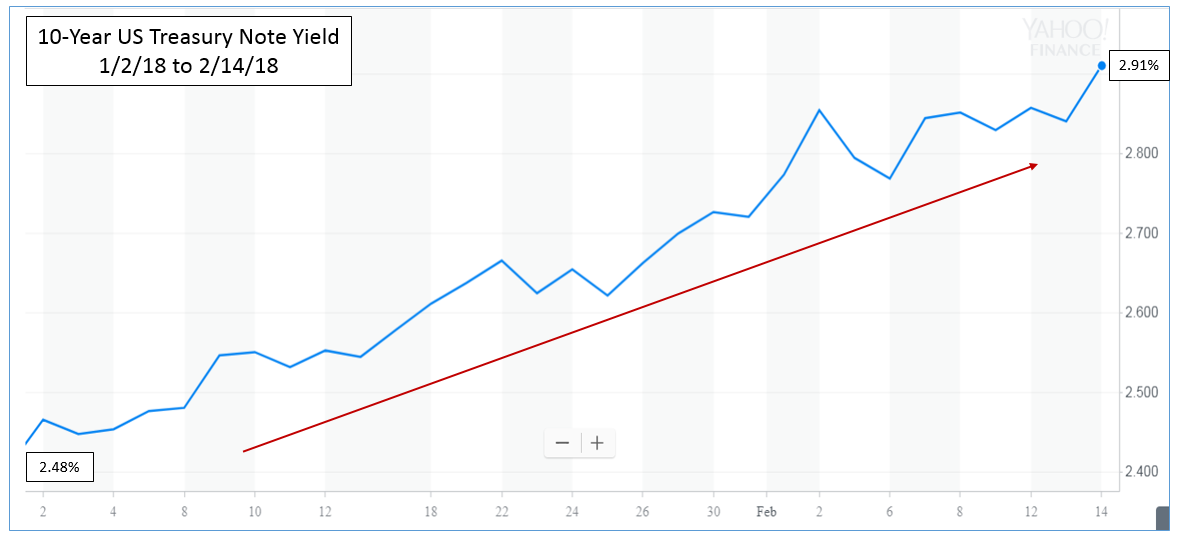
First, market interest rates have risen in 2018. In fact the bellwether 10-year US Treasury Note has gone from yielding 2.48% at the beginning of the year to currently yielding 2.91%. See the chart below:

Lower interest rates make stocks more attractive and higher rates less attractive. Yes interest rates are higher, but I’m not sure that a 2.91% interest rate over the next ten years is enough to entice investors to abandon stocks and rotate to bonds. Interest rates are rising off generational lows due to the strength in the economy and the conclusion of Federal Reserve monetary policy designed to keep rates low. Remember, the longer term average of the 10-year Treasury is roughly 4.0% and we’re still a long way from that rate.

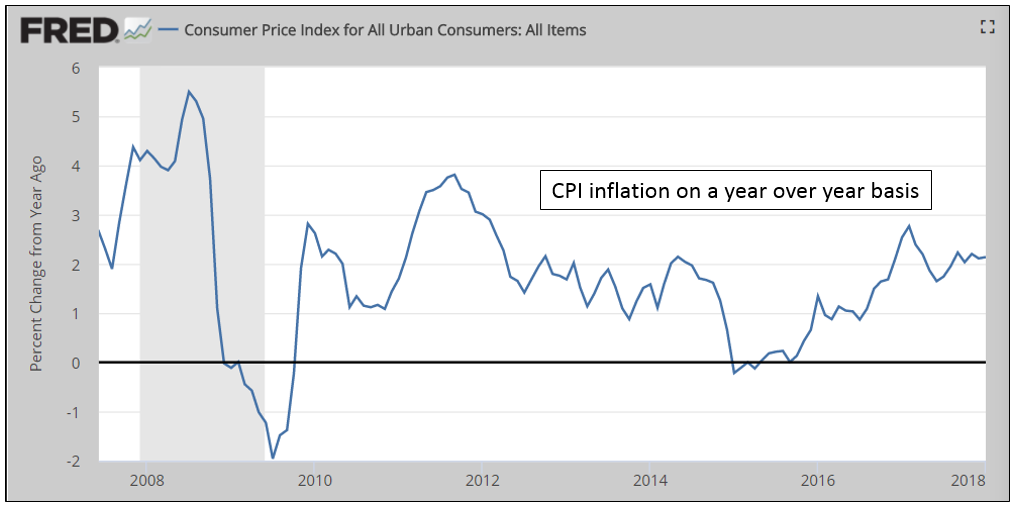
Secondly, inflation fears are creeping into the market again. The January CPI report came in slightly higher than economists had been predicting. A strong economy, low unemployment and wage growth seems to be pushing CPI inflation higher. See the chart below illustrating inflation levels since 2008:

Inflation has risen to approximately 2.1% on a year over year basis, but this level is not exactly what I’d call runaway inflation. In fact the Federal Reserve Bank considers inflation levels of 2.0 to 2.5% its target for a healthy economy. If inflation started to move over 3.0% that would begin to raise yellow flags.

Both interest rates and inflation bear watching as they can affect the stock markets. In our opinion neither current interest rates nor levels of inflation are enough to derail the positive fundamentals in the stock market right now. As long as the economy remains strong, corporate earnings growth stays robust and valuations stay within reason, our forecast for positive returns in the US stock market remain intact.

To expand on these Market Reflections or to discuss any of our investment portfolios, please do not hesitate to reach out to us at 775-674-2222.


Posted on February 15, 2018 Read More