Pandemic: Round Two

Virus cases in the U.S. surged in July as cases now top 4.3 million.  This number has doubled in just the past six weeks.  This resurgence in virus cases has caused the economy to lose some momentum from improvements made in May and June when restrictions were first being relaxed.  The spike in cases has slowed reopening plans and required some industries to scale back their forward revenue/profit guidance. The airline industry for one has been forced to reduce their flight schedules once again and are now looking for ways to permanently downsize their workforce to save money.  While some industries are in the fight for their long-term survival other industries like technology, pharmaceuticals, and consumer staple companies have been thriving in the pandemic.

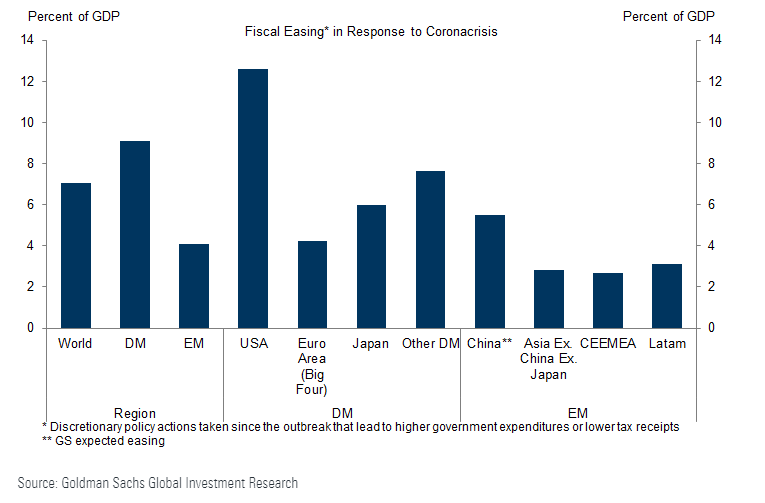
Despite the coronavirus’ impact on the economy, business, work, consumer spending, and our lifestyles; the stock and bond markets have exceeded most expectations since the March market crash.  It is important to understand and appreciate the positive impact fiscal and monetary actions has had on the markets, workers and consumers over the past five months.  Before Congress leaves for their next recess in early August, expect another round of fiscal stimulus.  A $1 trillion stimulus bill is currently being discussed which would include another $1,200 stimulus check to qualifying households.  Governmental assistance is a global event as many countries are desperately trying to avoid an extended recession.  Data below shows government’s record fiscal stimulus as a percentage of their GDP.  You can see the U.S. is leading the way in this regard, but everyone is participating.

In addition to government actions, global central banks are backstopping the markets with unprecedented accommodative monetary policies.  In the U.S., the Federal Reserve Bank has made liquidity a top priority making money readily available to banks and businesses.  This is evident by the further expansion of the Fed’s balance sheet over the past five months.  Prior to the 2008 recession the Fed balance was steady at the $800 billion level.  To save the banking system and cushion the impact of the recession, the Fed expanded their balance sheet to $4.5 trillion while keeping key short-term interest rates targeted at zero for seven years.  Just as the Fed was beginning to shrink their balance sheet and slowly raise interest rates, the coronavirus hit and the Fed returned interest rates to zero and expanded their balance sheet to a mind boggling $7.0 trillion.

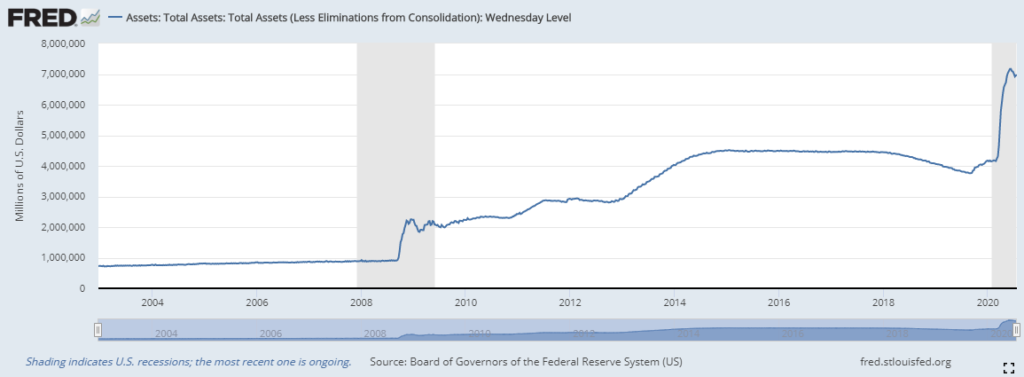
For those wondering why the markets are performing as well as they are, these two charts speak volumes.

The economic numbers released in July showed some improvement, but there is still a long road back to the 2019 economy. The July unemployment report showed 4.8 million jobs added, well above expectations.  The unemployment rate stands in double digits at 11.1%, though much improved from the 14.7% April number and a far cry from the December 3.5% unemployment rate. The Purchasing Managers Index rebounded nicely to 47.9 (June’s number reported in July) from 37.5 in the previous monthly report.  The reading is still below 50 which signals contraction.  Inflation is still well under control with core CPI running at 1.2% year over year.  The University of Michigan Consumer Sentiment Index dipped to 73.9 reflecting the angst among consumers in this uncertain environment.  This number hovered around 100 before the virus and now sits at a multi-year low.  As expected, second quarter GDP annualized quarter over quarter number was reported down 32.9%.  This was the worst quarterly economic decline ever.   

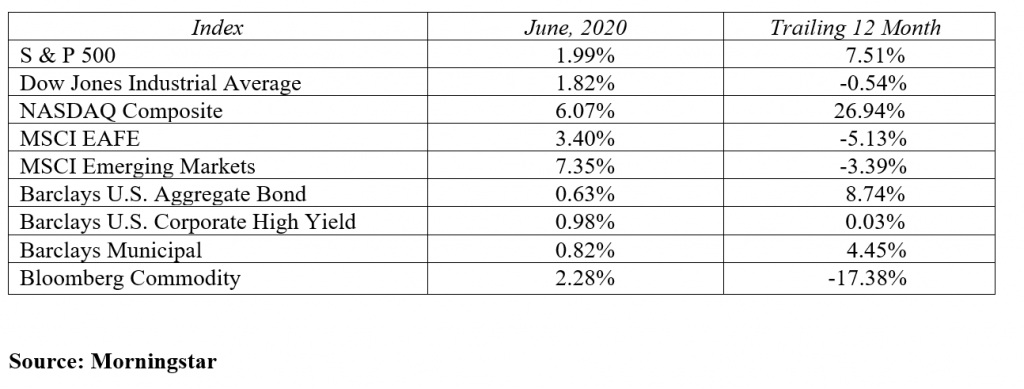
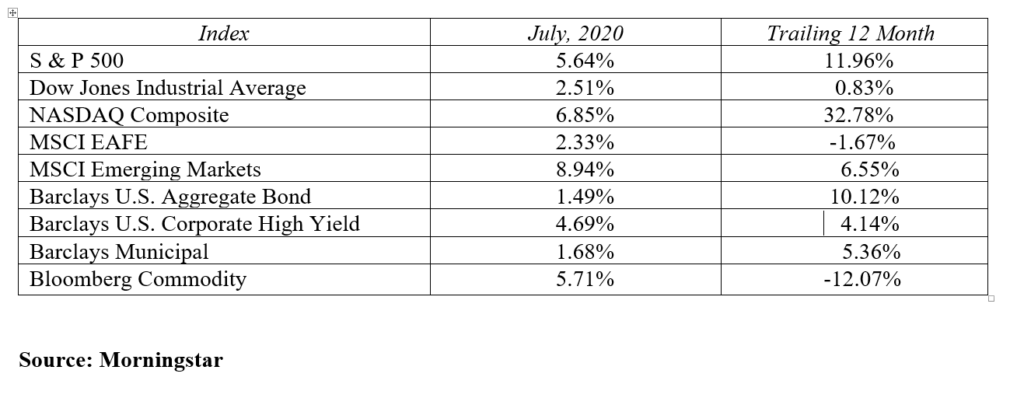
Despite all the current news and anxiety regarding the resurgence of the pandemic, the stock market continues to move onward and upward.  Big technology names have provided the leadership with the NASDAQ composite trading at record levels north of 10,000.  Names like Amazon, Apple, Tesla, Netflix and Facebook find new all-time highs on a regular basis.  The NASDAQ returned 6.9% in July followed by the S&P 500 up 5.6% and the Dow Jones Industrial Average posted gains of 2.5% in the month.  International stocks also had a profitable month with international developed stock markets rising 2.3% and emerging markets adding an impressive 8.9% in the past three months.  Gold also had a big month crossing the $2,000 an ounce barrier as the U.S. dollar weakened.       

The bond market is in a period of calm and it may stay this way for an extended period of time.  The Federal Reserve acted quickly to move key short-term interest rates back to zero back in March.  They stated publicly that the zero interest rate policy would likely be in place until 2024.  The U.S. Treasury yield curve appears to be in a lockdown of its own with rates lower again in the past month.  The 2-year U.S. Treasury note declined 5 basis points to yield just 0.11% at month end.  At the longer end of the yield curve, 10-year note fell 11 basis points to yield 0.55% while the 30-year U.S. Treasury bond had a significant decline of 21 basis points to yield just 1.20% at month end.  Mortgage rates are now at all-time lows helping support the housing market.  Both high yield and investment grade corporate debt saw a continued narrowing of credit spreads which explains their strong relative performance this month. 

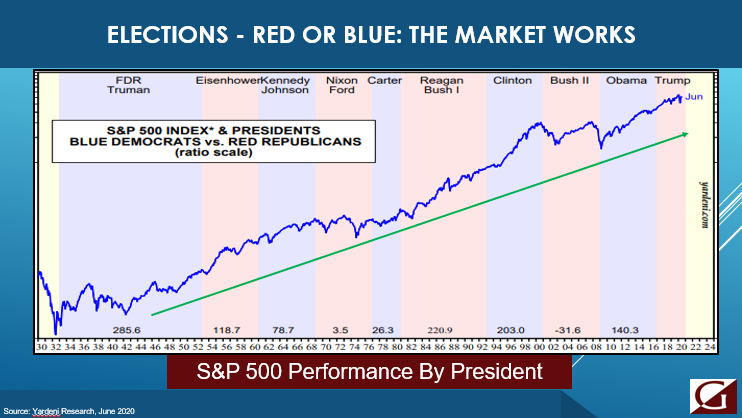
Forecasting the market is challenging in normal economic times.  In these extraordinary times of viruses, social unrest, China tensions and a quickly approaching presidential election, predicting the market’s next move is basically impossible.  For the glass half full crowd, you can gain comfort from the aggressive fiscal and monetary policies in place and the possibility of an effective virus vaccine sometime in 2021.  For the pessimists out there, you likely see the glass as completely empty.  The negative news can feel overwhelming at times, but remember every time period has its wall of worry to climb.  During this period of uncertainty it may seem like the wall is insurmountable, but only because it is the wall directly in front of us.  The market will climb this current wall of worry and then start the next climb over new worries once today’s concerns are behind us.  Instead of focusing on where the market may or may not be headed, stay focused on your investment goals, objectives and risk tolerance.  There you have control.  The markets will take care of themselves over time.

To expand on these Market Commentaries or to discuss any of our investment portfolios, please do not hesitate to reach out to us at 775-674-2222.

Posted on August 5, 2020 Read More

Election on the Horizon

Historically, stock markets have not reacted well to periods of great uncertainty that create a higher degree of question regarding the trends of future earnings.  2020 has certainly been a year of high uncertainty as a result of Coronavirus and the subsequent effects on the global economy.   While investors are still dealing with the potential ramifications of Coronavirus and companies’ ability to adapt to “the new normal”, the elections in November are an upcoming secondary source of uncertainty. 

Whether we have continuity from the current administration, or a change in leadership, it is our opinion that markets tend to adapt and move higher regardless of who wins the election.  Investors that mix politics with portfolios tend to perceive an unfavored political outcome as negative for their portfolio. Historically, however, the stock market performs well under Republican and Democratic administrations. In the chart below, the performance of the S&P (blue line) rises over time regardless what party is in charge. The light blue shaded area represents periods when a Democrat was President and the red shaded area represents time periods when a Republican was President.  As you can see, the constant among both Democratic and Republican administrations is the ability for the market to grind higher. 

As we move closer to November, a lot of attention will be paid to election polls and predictions. The early election polling reflects a potential for a policy administration change. The initial consensus is that a Democratic sweep may be less business friendly than the current administration.  While prediction of both the election and the resulting reaction of the market is extremely difficult, an examination of historical precedent can reflect how markets have performed during various scenarios.

As an example, history has shown if the Democrats sweep the presidency as well as congress, the returns for the S&P 500 on average are positive. In the graph below when a Democrat is President and Congress is also controlled by Democrats the average annual return for the S&P 500 going back to 1928 is 14.1% (red circle).  While history is a good guidepost, it is never a certainty.  Markets, and the companies within them, have shown a high degree of ability to adapt to various political environments and continue to provide value to their shareholders.

The upcoming election in November is yet another uncertain event with an unknown outcome.  Uncertainty, however, is simply a part of investing and, over time, markets have proven adaptable and able to prosper regardless of which party controls the White House.  It is Gradient’s opinion that politicians tend to have less influence on markets than most realize, and a well-defined investment plan tends to outlive political actions.

To expand on these Market Reflections or to discuss any of our investment portfolios, please do not hesitate to reach out to us at 775-674-2222.

Posted on July 21, 2020 Read More

Quarterly Market Review

The financial markets have worked overtime to discount an inordinate amount of new information in real time to assess the future global economic picture.  When this quarter began, the stock market was just beginning to pick itself up from one of the worst and quickest declines in history.  The 34% decline from February 19 to March 23 this year was an indication of just how weak the economy would be in the second quarter.

The economic numbers released over the past three months confirmed the story the stock market predicted.  The unemployment rate peaked at 14.7% as over 20 million jobs were lost in the economic lockdown.  The housing market saw large declines in both starts and permits for new homes.  The consumer, who had been the engine for economic growth, was essentially shutdown causing consumer spending and consumer confidence to plunge in the second quarter.  First quarter GDP fell 4.8% and second quarter GDP is expected to decline by an astounding 50.0%.  Two consecutive quarters of negative GDP growth officially qualifies as an economic recession. This will mark the first recession since 2008/2009.

The headlines reminded us how bad things were, but the market began to shed light on how good things could become. The volatility experienced in the last week of the quarter also suggested we are not out of the woods just yet.  There is still a wall of worry the market needs to climb.  Signs of a second spike in coronavirus cases seem imminent as some states are slowing or partially reversing their economic reopening plans.  A therapeutic and eventually a coronavirus vaccine are still a few quarters away.  The 2020 election combined with social unrest and China tension creates a recipe for continued volatility in the second half of the year.

Despite all the current news and anxiety, the stock market had an excellent quarter as it looked toward a better future.   This was actually the best quarter since 1987.  The technology-heavy NASDAQ led the way with returns just over 30% and surpassed the 10,000 mark for the first time.  The S&P 500 and the Dow Jones Industrial Average posted gains of nearly 20% in the second quarter.  International stocks participated in the comeback quarter with international developed stock markets rising 14.9% and emerging markets adding 18.1% in the past three months.               

The bond market entered the quarter on the heels of the Federal Reserve’s rapid move to zero on key short-term interest rates.  With the interest rate floor firmly in place, rates experienced a quarter of relative quiet.  The yield curve remains positively sloped and interest rates ended the quarter basically where they began.  The 2-year U.S. Treasury note declined seven basis points to yield just 0.16% at quarter end.  At the longer end of the yield curve, the10-year note fell four basis points to yield 0.66% and the 30-year U.S. Treasury bond rose six basis points to yield 1.41% on June 30, 2020.  The real action in the bond market was found in the credit markets.  Both high yield and investment grade corporate debt saw a significant tightening in credit spreads.  Investment grade corporate bond spreads were basically halved from 3.15% at the start of the quarter to 1.61% at quarter end.  Spreads on high yield bonds collapsed 2.00% sending their bond prices significantly higher.      

When this year began, no one could have predicted the economic path traveled in just six short months.  Now that we are here, it is a perfect time to reflect on your financial plan, investment goals and objectives and to decide on your plan moving forward.  Risk tolerance is a widely used term in the investment profession.  There are numerous ways the industry tries to quantify this and help investors establish a personal financial risk assessment.  While this is an important exercise, the best risk tolerance questionnaire cannot capture how you tolerated the volatility in the markets during the past six months. Take a moment to reflect on 2020 to date.  How did you handle the emotional aspect of these wild swings in valuations?   How did your portfolio perform relative to your expectations?   Did your current income and liquidity support your current lifestyle?

The first quarter was the test.  The second quarter provided an opportunity to change your answer.  The next two quarters will have new surprises and the heightened volatility will likely persist.  Keep yourself healthy, safe and invested at a risk level that supports your emotional and financial well-being.                

Posted on July 7, 2020 Read More
Call Us: (775) 674-2222