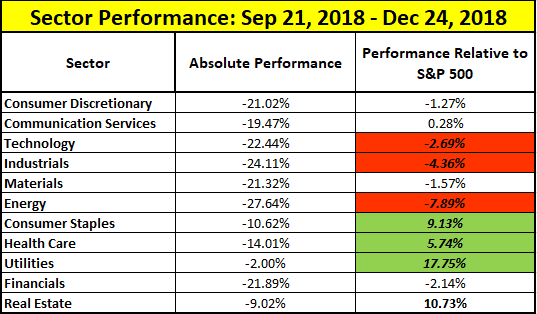
The first quarter was a welcomed turnaround for the financial markets following the fourth quarter setback. The bull market reignited in late December and caught fire in January. Momentum waned as the quarter unfolded, but each month produced positive returns for stocks and bonds. For the three month period, the S&P 500 gained 13.7% and the Barclay’s Aggregate Bond Index netted 2.9%.
The Federal Reserve played a key role in the market reversal as they pivoted to a dovish position on monetary policy. The year began with the market expecting the Fed to continue to raise the fed funds rate with regularity, but Chairman Powell proclaimed patience was the new path forward. His statement was interpreted to mean zero interest rate hikes in 2019 and the markets immediately rallied. The Fed’s new policy perspectives coupled with other encouraging news sent stocks soaring once again.
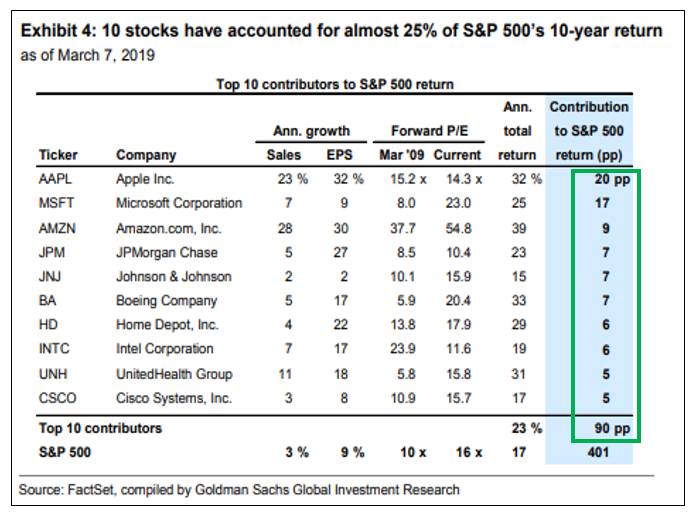
Fourth quarter earnings season was deemed a success with corporate earnings growing 13.4% making it the fifth consecutive quarter of double digit growth. Future earnings growth will likely settle into single digit territory. Employment data was exceptionally strong in December and January, but was offset by a disappointing 20,000 jobs created in February. March’s employment number will confirm if this was a one-time event or a new trend toward less job creation. The current 3.8% unemployment rate and growing wages still suggest a strong labor market. The end of the government shutdown was another bullish catalyst. A trade deal with China was anticipated all quarter, but now a deal is needed soon to meet market expectations.
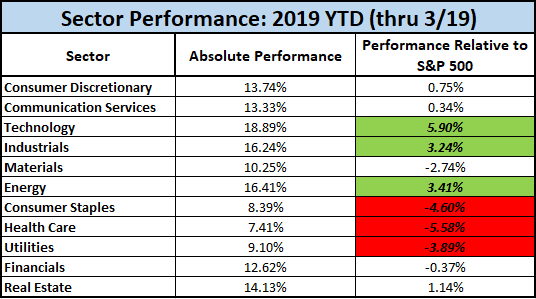
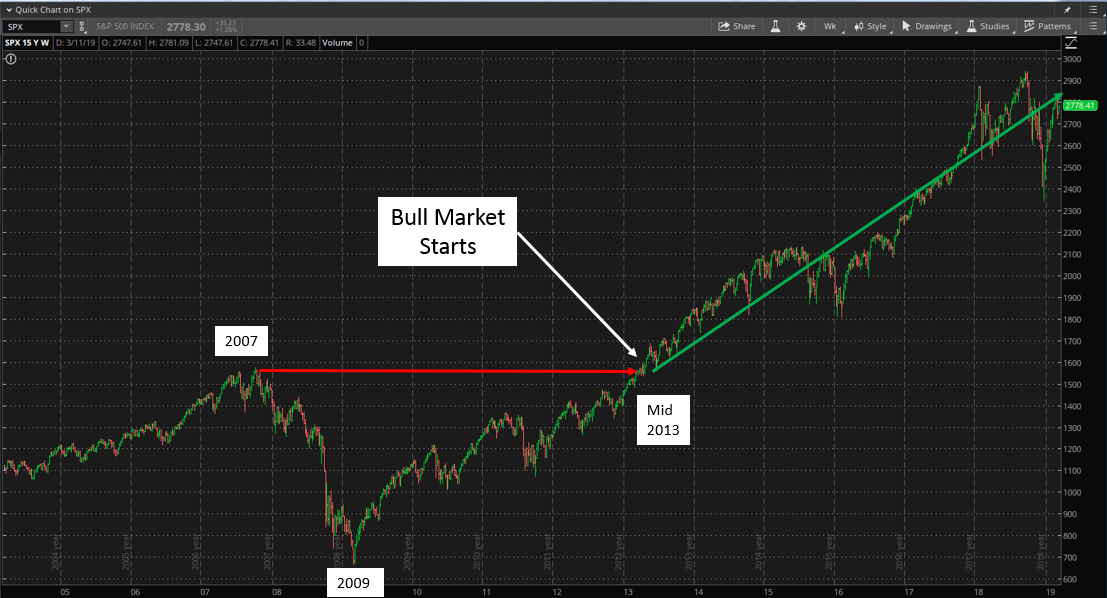
The major stock indices had a great start to the year with U.S. stocks outpacing international stocks. The bull market in U.S. stocks turned ten years old this March, a new historical milestone. The NASDAQ Composite, S&P 500 and the Dow Jones Industrial Average had sizable gains of 16.8%, 13.7%, and 11.8% respectively in the first quarter. Evidence of slower economic growth in international economies did not deter stock appreciation in those markets. The MSCI EAFE and emerging markets indices still produced gains of 10.0% and 9.9% in the quarter. This has been a traditional rally where growth and small capitalization stocks outperformed value and large capitalization stocks.
With stocks having a tremendous first quarter, one would expect bonds to be on the decline. This was not the case as interest rates and the shape of the yield were remarkably stable to begin the year. After the Federal Reserve meeting in March, the bond market rallied hard into quarter end. The combinations of the Fed’s revised policy leanings, continued low inflation, declining global interest rates, and stable economic growth brought a new optimism to the bond market. The Barclays Aggregate Bond Index gained 2.9% in the quarter. High yield bonds, beneficiary of a strong stock market, led all fixed income sectors with a 7.3% quarterly return. The benchmark 10-Year U.S. Treasury note traded in a tight range, then rallied, declining 28 basis points to end the quarter yielding 2.41%. The yield curve enjoyed a bullish flattening, as long-term interest rates fell more than short-term interest rates. For the quarter, the 2-Year Treasury fell by 21 basis points to end the period yielding 2.27%. Meanwhile, the 30-Year Treasury also fell 21 basis points to yield 2.81%. Most of the yield curve now has interest rates lower than the very short-term fed funds rate currently set at 2.5%.
The financial markets are adept at stirring investor emotions through unexpected price volatility and price momentum. The past three quarters provided a roller coaster ride from market highs to a double digit correction and back to market highs again. Hopefully, you let your portfolio ride along while keeping your emotions on the sidelines. The best approach to long-term investing is to stay invested at a portfolio risk tolerance that reflects both your financial goals and personality. We are still optimistic on stocks and bonds for the remainder of the year. After this very successful quarter, do not extrapolate these results through year end. If stocks can add an additional 5% and if bonds can hold these gains, 2019 will be deemed a successful year for the financial markets.
MARKETS BY THE NUMBERS: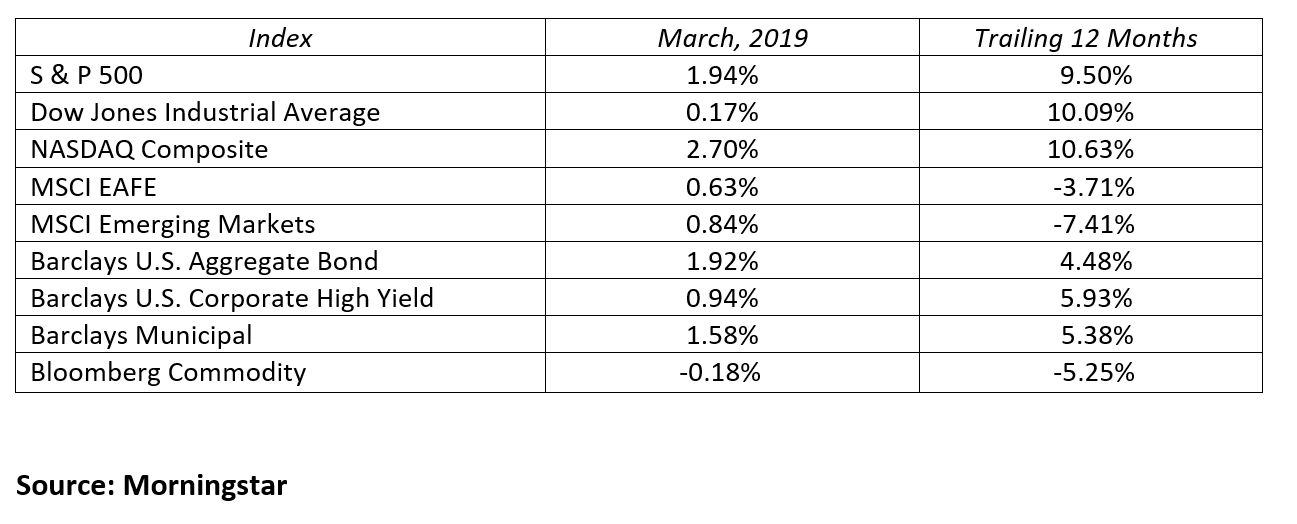
To expand on these Market Reflections or to discuss any of our investment portfolios, please do not hesitate to reach out to us at 775-674-2222.