Recent Federal Reserve Actions

On Wednesday, Federal Reserve officials held interest rates steady.  In the past, a steady rate has generally been regarded as “business as usual”, but the shifting discussion in the direction of future interest rates has created a changing dynamic in the markets.

First, a bit of brief history. In December 2018, the Federal Reserve raised interest rates and indicated there could be further tightening and more rate increases to come in 2019.  With a market already somewhat reeling from trade conflicts and a potentially slowing economy, the market took this news negatively and the markets declined nearly 20%.

Since that time, there has been a softening stance by the Federal Reserve, both in action and commentary.  We have had no interest rate increases since that December meeting, and with the discussions of this most recent meeting, the markets are considering a near certainty of rate cuts in the coming months.  The below chart from the CME group displays the probability of the level of interest rates after the next Fed meeting on July 31, 2019.  One month ago, there was a near 80% probability that rates were going to be left unchanged.  After the meeting yesterday, however, there is now 100% probability of at least a 25-basis point rate cut in the July meeting.

This shift of market perception and commentary from the Fed has had the following effects:

  • Bond markets have rallied as 10-year treasury rates have declined from 2.79% to 2.03%
    • BND, a widely used ETF and proxy for the bond market, is up 5.88% year to date
  • Interest rate sensitive sectors have been strong performers:
    • Real Estate stocks are up 24.16% year to date
    • Utilities stocks are up 15.84% year to date
  • The US Dollar, strong through most of the year, has weakened recently
    • As a result, gold prices have begun to rally, and are now up 5.48% year to date

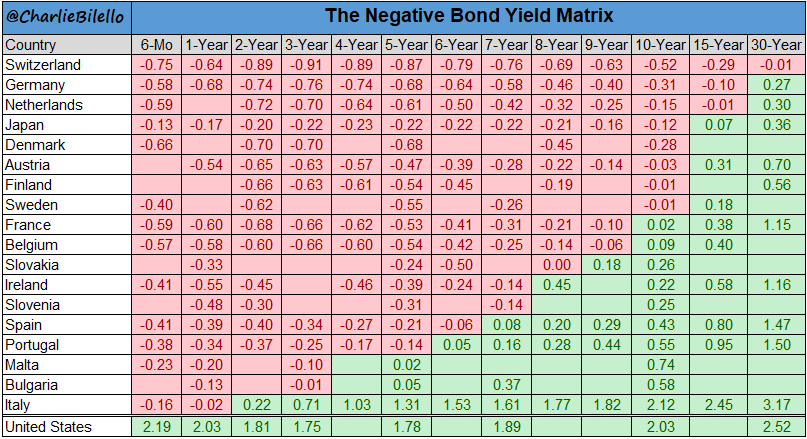
Lastly, while current yields for US treasuries are low by historical standards, they remain relatively high compared to the rest of the world.  The below chart reflects global bond yields, as of June 18, 2019, for several countries across the globe.  The data reflects that yields are negative for as far out as 30 years in Switzerland, and several other countries have negative bond yields out to 10 years.

To expand on these Market Reflections or to discuss any of our investment portfolios, please do not hesitate to reach out to us at 775-674-2222.

Posted on June 21, 2019 Read More

Trading Concerns

In last month’s commentary posted on May 1st, we highlighted the fact U.S. stocks were trading at all-time highs and reminded investors market corrections are normal.  Unfortunately, the stock market wasted little time in generating a 6.4% correction.  Losses continued to mount as the month wore on with the major stock indices piercing their 200-day moving average.  This was the first May since 2012 with negative returns.  The old Wall Street adage, “sell in May and go away”, is timely this year as we enter the summer months where June and August have historically been the two weakest performance months of the year.  While our long-term investing approach does not condone seasonal market timing, the recent increased volatility is a reminder markets move in both directions.

This sell-off was somewhat self-induced as the U.S. turned up the heat on China with the threat of a new round of tariffs.  The threat became reality as the administration raised tariffs from 10% to 25% on $200 billion of China imports.  China responded by boosting its own import taxes on $60 billion of U.S. products.  The path to a trade deal between the world’s two largest economies appears to be a long and winding road.  Stay tuned as President Trump and Chinese President Xi are expected to meet at June’s G20 summit in Japan.  Mexico was added to the trade discussion as President Trump announced a plan to implement tariffs on all Mexican imports.  Trade was not the lone concern as headlines related to political tensions, a continuing strong U.S. dollar, free-falling interest rates, a partially inverted yield curve and some initial widening of credit spreads also caused the stock market to pause.

On the economic front, the April jobs number added an impressive 263,000 net new jobs, blowing away the 190,000 forecast.  The jobless rate fell to 3.6%, the lowest reading since 1969.  Personal spending showed strong growth of 0.3% in April and personal income was up 0.5%, thus keeping the consumer in the game.  The second reading on first quarter GDP held strong with a 3.1% growth rate.  The first-quarter earnings season is nearly complete. Stock market analytics firm FactSet notes that 76% of the S&P 500 firms have beaten consensus earnings-per-share estimates. Overall earnings for S&P 500 components have surpassed expectations by 3.8%.

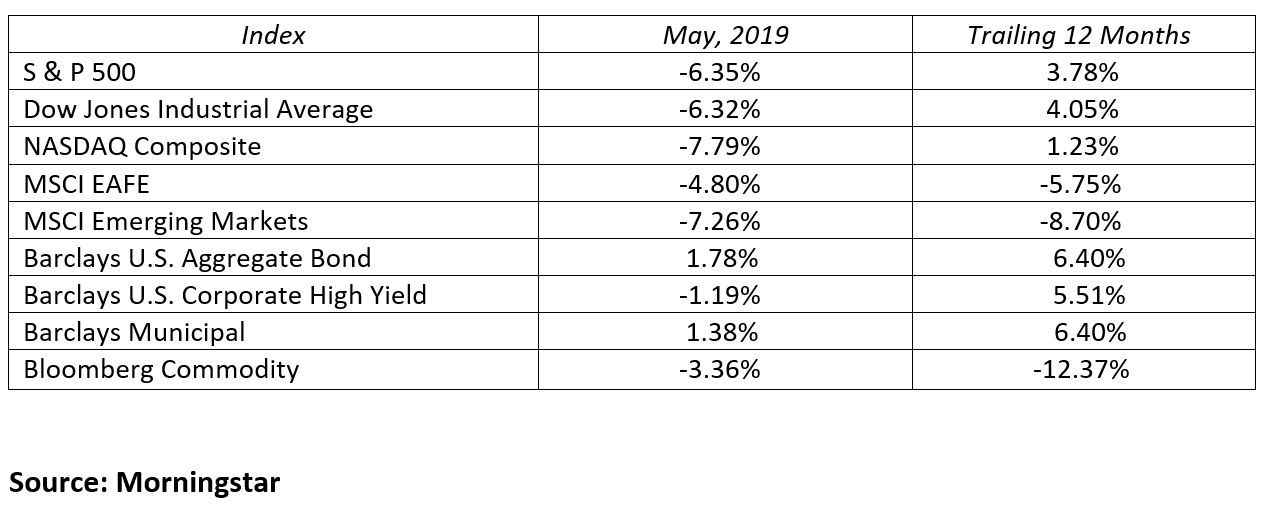
Stocks had a great start to the year, but ran into a brick wall in May.  The pain was universal as all major stock markets were in the red.  The NASDAQ Composite, S&P 500 and the Dow Jones Industrial Average gave back about one-third of this year’s gains with declines of 7.8%, 6.4% and 6.3% respectively in the month. The trade concerns are a global event and the international stock markets voiced similar concerns.  The MSCI EAFE and emerging markets indices also lost 4.8% and 7.3% in May.

The Federal Reserve held interest rates steady as expected and noted solid job and economic growth with tame inflation.  In their policy statement, the Fed reiterated their wait and see approach to the fed funds rate saying, “we don’t see a strong reason for moving in one direction or the other”.  The market is now telling us the Fed’s next direction will likely be a Federal Reserve rate cut before year-end.  Higher stock market volatility sent investors to the bond market to seek shelter.  Yields collapsed across the curve in eye opening fashion creating attractive monthly returns in bonds. This month, the 2-Year Treasury note yield fell a remarkable 32 basis points to yield just 1.95%.  With the fed funds rate pegged at 2.50%, it’s obvious the market is calling for a future Fed rate cut.  Yields also collapsed on the 30-Year Treasury bond as its yield shrunk 35 basis points to 2.58%.  In May, the 10-year Treasury note rallied with its yield declining from 2.41% to just 2.14% at month end.  The rally in the bond market raises the question, “does the bond market know something the stock market does not?”  Time will tell, but lower U.S. Treasury yields, a yield curve inversion and wider credit spreads are worthy of our attention.

On the commodity front, the market witnessed oil and gold moving in different directions.  West Texas Intermediate crude oil price per barrel fell back into the low $50s after trading in the mid-$70s just eight months ago.  Oil, down 12.0% this month is now back at February levels.  Gold on the other hand is at a seven week high of $1,305 per ounce as nervous investors look to precious metals for relief.

Ups and downs like this come with the territory, but it’s imperative to stay patient and think long-term instead of short-term.  Every time period has headline risks that investors must confront.  This time is not different.  Remember, underlying the headlines is a strong economy with solid corporate earnings, a confident consumer, and fair stock valuations.  Stay invested for the long haul and let your long-term objectives and risk tolerance guide your investment decisions.

MARKETS BY THE NUMBERS:
 

To expand on these Market Commentaries or to discuss any of our investment portfolios, please do not hesitate to reach out to us at 775-674-2222

Posted on June 5, 2019 Read More

The Trade War Escalates

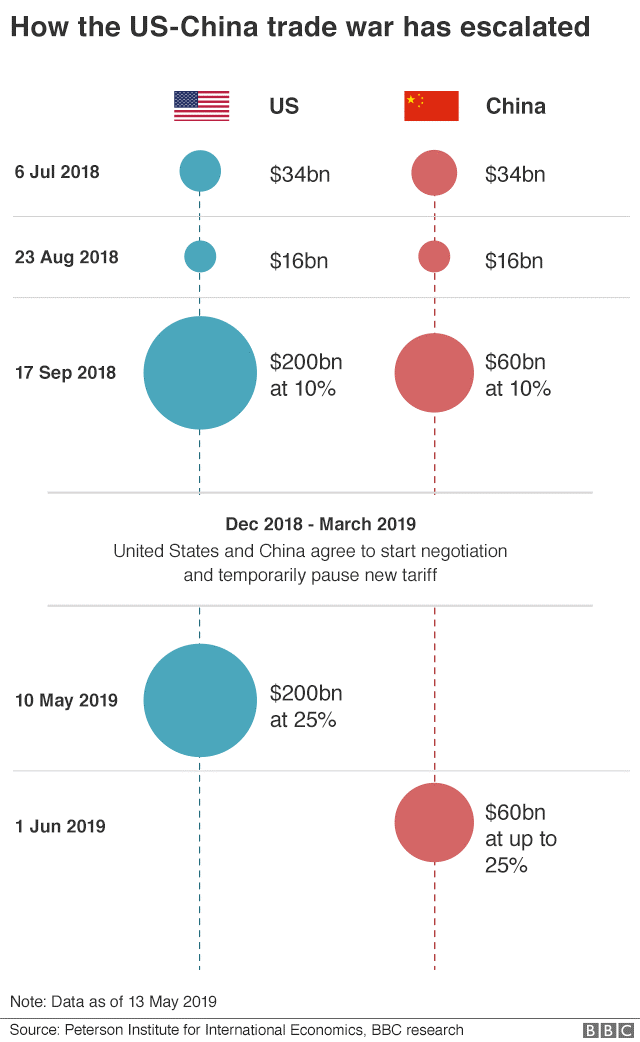
The stock market has been correcting the past week as investors fear the economic ripple effects of escalating tariffs between the US and China. What started back in March of 2018 as tariffs on imports of Chinese steel and aluminum has escalated to tariffs on hundreds of billions of dollars on thousands of products by both the US and China. Investors were led to believe that trade discussions were constructive until last week when the US announced that trade discussions had hit an impasse. In response:

  • The US will be raising tariff rates from 10% to 25% on $200 billion of goods and an additional $325 billion would be tariffed at 25%
  • China retaliated by announcing higher tariffs on $60 billion worth of US imports of more than 5,000 items

Tariffs are essentially taxes designed to increase the price of imported goods. The purpose is to make domestic goods cheaper and imported goods more expensive. It’s a form of industry protectionism implemented by the tariffing country. The problem is:

  • Tariffs are a barrier to global trade
  • Other countries tend to retaliate to US tariffs with tariffs of their own
  • Certain industries are hit much harder than others
  • Most often tariffs end up being an additional tax on consumers
  • The sum effect of global tariffs is downward pressure on global growth and higher prices to consumers

It’s because of the potential for lower global growth that investors become concerned when trade tensions escalate. But before we panic, let’s examine a few facts. According to First Trust’s Chief Economist:

  • In 2018 the US exported $180 billion of goods to China, this is roughly 0.9% of our GDP*
  • In 2018 China exported $559 billion of goods to the US, this is roughly 4.6% of its GDP*

Obviously China has more at stake here than the US does in a trade war between the two countries. The US is also concerned about increasing trade deficits with China and the fact that China is widely believed to be involved in theft of US intellectual property. President Trump hopes these tariffs will force China to craft a long term trade agreement with the US that is fair to both.

The escalation of the trade tariffs and a strong US market in 2019 has caused investors to hit the pause button and take some profits. For now it looks like we won’t get much trade resolution until China President Xi Jinping and Donald Trump meet at the G-20 Summit next month. Below is an illustration of the trade tariff timeline between the US and China:

For the time being the markets could be more volatile than usual. In these turbulent times a good example of an ETF that can protect investors from volatility is Invesco’s S&P 500 Low Volatility ETF. The Gradient Tactical Rotation (GTR) strategy rotated to this sub sector in November of 2018 and has been invested there since. This has proven to be an opportunistic rotation as the US low volatility sub sector of the global market has performed well in the last 6 months.


To expand on these Market Reflections or to discuss any of our investment portfolios, please do not hesitate to reach out to us at 775-674-2222.


Posted on May 14, 2019 Read More