2020 has been a year of dramatic swings in the US stock market, with a decline from all time highs on Feb 19, 2020 to down over 30% in just over a month and a 30% rally off the March bottom. Within this timeframe, there has been a large divergence in performance between stocks that have recovered and even exceeded prior highs while others are languishing and have not experienced the level of recovery seen in the broad market index (S&P 500). The segments of the market that reflect this is the divergence of growth versus value stocks.
Loosely defined, growth stocks tend to have higher revenue and sales growth and historically have had higher valuations and greater volatility. On the contrary, value stocks tend to have lower revenue and sales growth (more mature companies) but have historically held lower valuations (cheaper) and lower volatility. The S&P 500 is an index that has both growth and value stocks, and the index provider of the S&P (S&P Global) uses various metrics to dissect the 500 companies into value or growth segments. While not perfectly segmented, the S&P 500 is approximately 50% value and 50% growth.
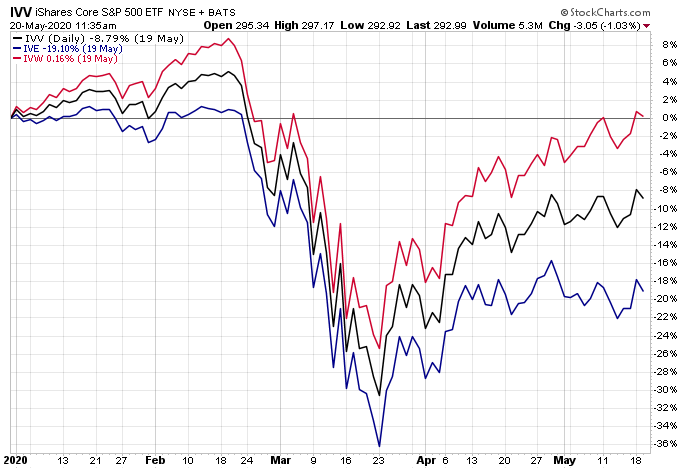
Using ETFs that represent the S&P 500 (IVV – black line), growth stocks (IVW – red line) and value stocks (IVE – blue line), the performance differential in 2020 (through 5/19/20) is quite dramatic.
The S&P 500 is down 8.79%
Growth stocks are now actually up on the year (up 0.16%)
Value stocks are languishing (down 19.10%)
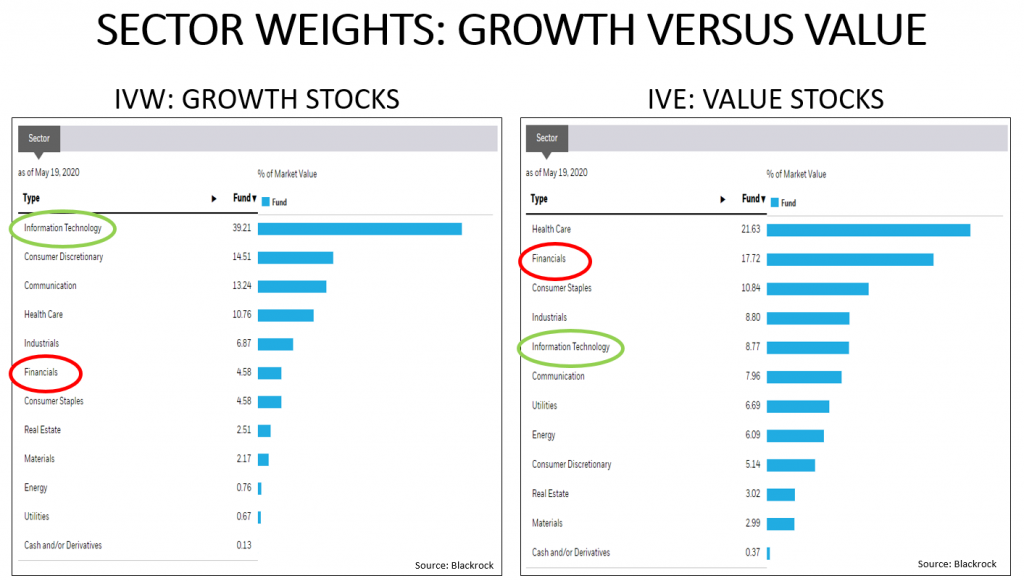
A significant factor for the level of outperformance in growth stocks over value has been sector composition. The data below shows the segmentation of IVW (growth stocks) on the left versus the IVE (value stocks) on the right.
Technology stocks represent nearly 40% of growth compared to less than 10% of value
Financials represent nearly 18% of value compared to less than 5% of growth
Technology stocks (Apple, Microsoft, and Visa) have significantly outperformed Financials stocks (JP Morgan, Bank of America, and Wells Fargo)
In Consumer Discretionary, Amazon (which has outperformed significantly) is a large percentage of the growth ETF (over 7%) while the value ETF has no position
Why is this important?
Within Gradient stock portfolios, the investable universe is dependent upon the stated objective. For example:
The G50 is a blue-chip, US, dividend paying stock portfolio designed for growth and income.
The investable universe for the G50 tends to be much more heavily weighted in value stocks, as those stocks have historically been the companies that pay higher dividends.
On the contrary, the G33 portfolio is a diversified growth portfolio designed for long term price appreciation.
It isn’t concerned with dividends and is going to invest in growth companies (like Amazon and Google) and will not be invested in value stocks.
The performance between the two portfolios reflects this difference in objective, as the G33 portfolio has had much greater performance in 2020 compared to the G50.
As these differentials of performance tend to normalize over time, but are difficult to predict, our preferred approach for investors is to have a blend of both and to periodically rebalance based on opportunity and risk. There are several ways to accomplish this, which include:
A mix of the G50 for value and the G33 for growth (rebalanced periodically)
An allocation to our Core Select portfolio – which invests in both growth and value segments
An allocation to our Tilt Series – which is actively managed and includes G50, G33, and Core Select allocations in a mix determined by the Gradient Investment Committee
To expand on these Market Reflections or to discuss any of our investment portfolios, please do not hesitate to reach out to us at 775-674-2222.
The unemployment rate is a key economic indicator that provides insight into the health of the U.S. economy. Understanding the trends of unemployment, and what comprises the rate, is important to determining the general direction of economic growth.
The unemployment rate measures the percent of the labor force that:
Does not currently have a job
Is actively looking for work within the past four weeks
Is available to work
The rate includes furloughed workers who are temporarily unemployed and waiting to be recalled to work from the employer.
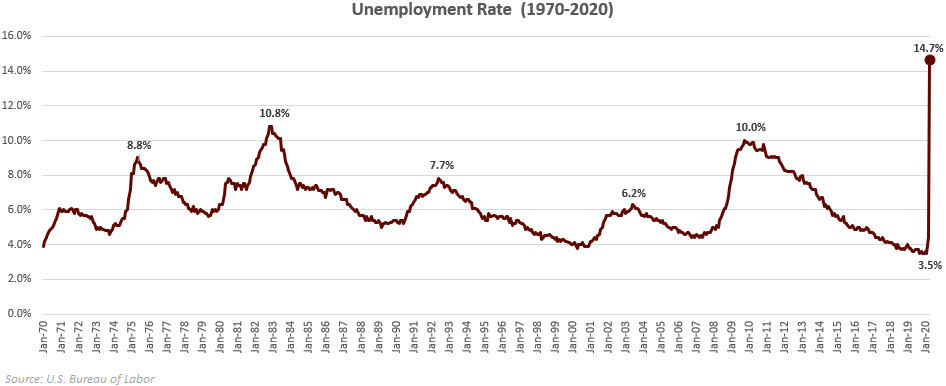
In April, the unemployment rate jumped to 14.7%, which is the highest number we’ve seen in recent history and is equivalent to one out of every seven working persons unemployed. To compare, here is the peak unemployment reached during prior times of crisis:
Financial Crisis: 10.0%
1980 Energy Crisis: 10.8%
1973 Oil Crisis and Stock market Crash: 8.8%
Great Depression: 24.9%1
Furthermore, the spike in unemployment has been much more rapid than in previous recessions. During the Financial Crisis in ’08-’09, the lowest unemployment rate was in March of 2007 at 4.4% and it wasn’t until 31 months later that we saw the peak of 10.0%; the current unemployment rate went from 3.5% to 14.7% within one month and can be seen in the chart below2.
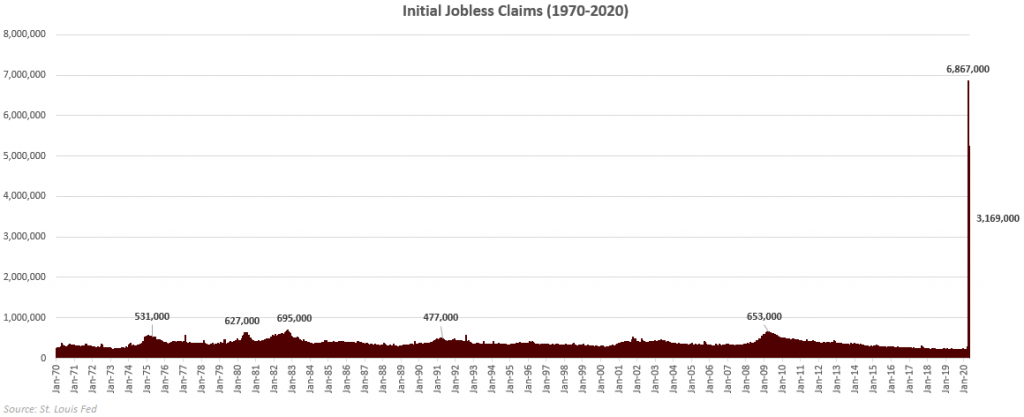
While the unemployment rate is an important indicator, it is also generally a lagging indicator of the economy. An early indicator that provides insight into trends for the unemployment rate is Initial Jobless Claims, which tracks the weekly number of claims for unemployment insurance. These claims do not include past weeks and are inclusive of the claims filed during that specific week. The chart3 below shows the spike in claims that began in the second week of March reaching an all time high of 6.8mln claims during the fourth week of March. Before the impact of the COVID-19 pandemic, the average weekly claims dating back to January of 1970 was 359,000 per week.
Using these two data sets together give us a picture of the health of the job market and a glimpse into the trends of the U.S. economy. No statistical number should be used in isolation, but the direction of employment is a critical element to U.S. consumer spending which drives our economy. It is also important to acknowledge trends in the market rather than the number itself – are they improving and better than expectations (good) or are they deteriorating and worse than expectations (bad). These trends are clearly negative right now and could worsen until social restrictions begin to lift and workers are able to find jobs. How fast these trends change will provide greater insight into how fast the economy is rebounding from this most recent crisis.
To expand on these Market Reflections or to discuss any of our investment portfolios, please do not hesitate to reach out to us at 775-674-2222.
These uncertain times are putting all of us to the test. The coronavirus has temporarily changed our lives and our economy in ways we never thought possible just two months ago. While the pain and anxiety are real, it is important to realize this pandemic is a comma and not a period. This pause in our normal way of life will eventually end and the economy will someday resemble its former self. While the path to prosperity is unknown, the recent actions of the stock market are providing some signs of hope.
The stock market is a discounting mechanism that essentially takes into consideration all available information regarding present and future events. As unexpected news happens, the stock market incorporates this new information very rapidly into current market prices. Over the past three months, this has played out in dramatic fashion. The 34% decline in the S&P 500 from the Feb 19th closing high to the March 23rd closing low was the result of the market discounting the future economic impact of the coronavirus. The 31% rebound in stock prices from the March low to the April 29th high was the collective wisdom of the market handicapping an expected stronger economy in the next three to six months.
While the future may be brighter, the current hit to the economy has been devastating and is reflected in the dreadful economic numbers being reported. Thirty million workers have lost their jobs in recent months, which is more than all of the jobs created in the eleven year economic expansion. The unemployment rate is fast approaching 10% after spending much of 2019 and early 2020 hovering around 3.5%. U.S. GDP contracted at a 4.8% rate in the first quarter, worse than the -4.0% expected. U.S. first quarter imports fell 15.3% while exports declined 8.7% and consumer spending was also down 7.6%. Despite record low mortgage interest rates, the housing market is declining rapidly. Manufacturing and retail sales have been hit especially hard with consumers on lockdown. The world needs to return to school and work while simultaneously keeping the virus under control. Businesses need to reopen and consumers must spend again so the economy can heal.
The Federal Reserve Bank in collaboration with the U.S. Department of Treasury have directed trillions of dollars to be funneled to individuals, small businesses, large corporations, banks, states and municipalities. The Federal Reserve and Congress injected funds and fiscal stimulus equal to 20% of U.S. gross domestic product. This is threefold the size of the stimulus injected during the 2007-2009 financial crisis. All these aggressive actions were done to help mitigate the economic damage from the pandemic:
Reduced the fed funds rate to zero
Provided forward guidance suggesting rates will remain low for the foreseeable future
Resumed massive amounts of security purchases (Quantitative Easing – QE)
Revived a lending program to securities firms to keep credit markets functioning
Initiated a lending operation to banks to backstop money market mutual funds
Expanded the scope of repurchase agreements to offer an unlimited amount of money to money markets
Offered direct lending to major corporate employers and municipal governments
Supported loans to small and mid-sized businesses offered through banks
The U.S Department of Treasury in conjunction with Congress and the administration has guided multiple fiscal relief programs to help support the economy:
President Trump declared a national emergency making $50 billion available for states
The Families First Coronavirus Aid Package was signed into law
An $8.3 billion emergency coronavirus aid package was signed
Phase three of the Coronavirus, Aid, Relief and Economic Security (CARES) Act provides an estimated $2 trillion economic package
The Paycheck Protection Program (PPP), a new loan initiative aimed at helping small businesses and their employees
An additional $484 billion made available for small business
Preliminary work on a nationwide infrastructure bill
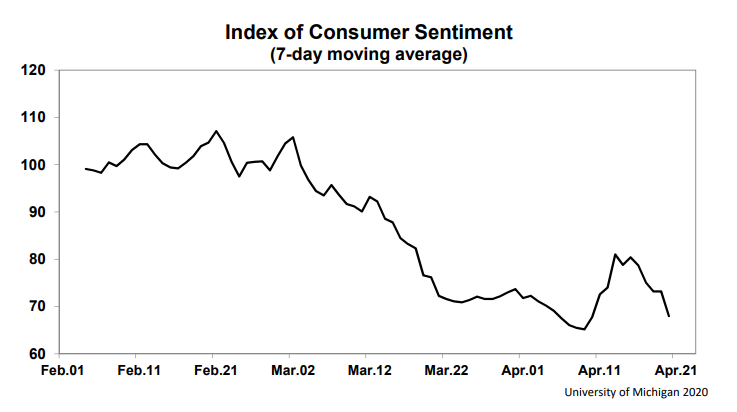
The government has pulled out all of the stops to keep the country on life support until the economy can be reopened for business once again. Some states are beginning to relax guidelines allowing businesses to gradually reopen. While this is an encouraging sign, there are legitimate concerns about re-acceleration of the virus in a post lockdown world. Also, consumer sentiment has been decimated, plunging to a nine-year low in the pandemic’s wake. A return to economic normalcy will require the population to feel safe, workers to return to work and consumers confident to spend once again.
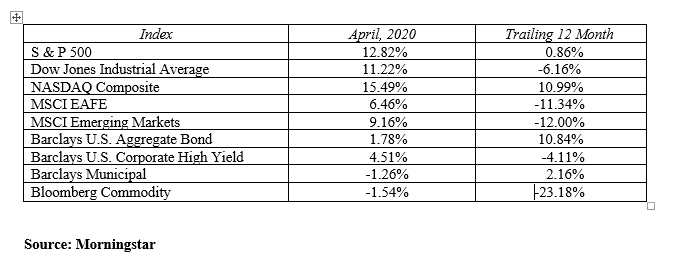
The virus-induced bear market received some much needed relief in April. Rebounding from huge losses in March, the S&P 500, Dow Jones Industrial Average and NASDAQ returned 12.8%, 11.2% and 15.5% respectively last month. International stock markets followed suit with international developed stocks rising 6.5% and emerging markets gaining 9.2%.
The story beneath the numbers is a tale of both sector and individual company winners and losers. The airline, hospitality and energy industries have been hit especially hard as demand for those services and products evaporated in the wake of the stay at home orders. Other companies like Amazon, Costco, Netflix, Abbott Labs, Johnson & Johnson, and Domino’s Pizza are thriving in this locked down economy. Commodity prices are also all over the map. The price of gold is approaching its high price from eight years ago. At the same time, oil is suffering as supply and demand imbalances drove the price May futures contracts for a barrel of oil into negative territory briefly in April. Gasoline prices are now approaching $1.50 per gallon in many parts of the country.
The most asked question is, “Have we seen the market low?” If the virus delivered its one-punch, the worst is likely behind us. If this is a one-two punch, we still need to brace for the second punch. For the glass half full crowd, one can find solace in the measured reopening of businesses, the stabilization of oil prices, the ebbing of market volatility, the flattening of the coronavirus curve and stocks bouncing hard off the March lows. A true game changer would be the development of an effective therapeutic to the coronavirus and ultimately a vaccine. Shortening the economic downtime will accelerate the rebound.
Interest rates were little changed this month remaining near their all-time low yields. The U.S. Treasury yield curve has maintained its positive slope with the 3-month Treasury bill yielding just 0.09% and the 30-year Treasury bond generating a 1.28% yield at month end. The 10-year note traded in a fairly tight range in April and closed the month with a 0.64% yield. The bounce back in the stock market gave the corporate credit markets a much needed boost. Credit spreads on both high yield bonds and investment grade corporate bond recovered about one-third of the damage done from the previous month selloff. This is evident in the monthly return numbers as high yield and investment grade corporate bonds outperformed U.S. Government bonds by 388 and 395 basis points respectively.
Every generation has been forced to deal with several periods of market volatility during their investment lifetimes. For the baby boomers, it has been stagflation in the 70’s, Black Monday in October of 1987, the internet bubble bursting in spring of 2000, the financial crisis of 2007-2009 and now – from out of the blue – the coronavirus crash. Millennials endured the past two crises, and they will likely see four more major corrections in their lifetime.
These periods of extreme volatility are emotionally unsettling and may cause you to rethink your entire investment approach. Resist the temptation to make hasty decisions that will have long-term implications. It is best to take a step back from the daily panic, and allow yourself to let the big picture come into focus, and appreciate the positives in your financial plan. Everyone’s silver lining may be somewhat different, but allow yourself to see it. It could be a solid income plan, a bond ladder covering the next five years of cash needs, great diversification, a suitable asset allocation, or the realization that your monies invested in long-term growth are not needed within the next five to ten years. Keep a long-term focus and stay positive. This too shall pass.
MARKETS BY THE NUMBERS:
To expand on these Market Commentaries or to discuss any of our investment portfolios, please do not hesitate to reach out to us at 775-674-2222