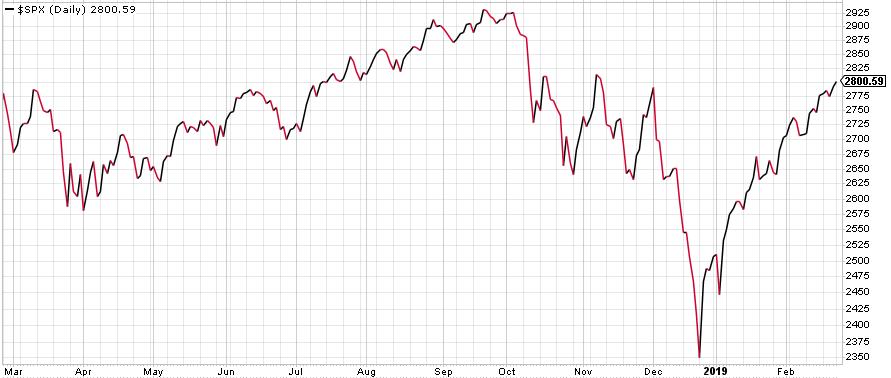
After one of the best Januarys in the past three decades, stocks were able to build on to those impressive gains. As a matter of fact, the Dow Jones Industrial Average has produced nine consecutive weeks of gains to begin the year. This streak last happened 24 years ago. The bond market found a period of calm as interest rates and credit spreads were quite stable throughout the month. February had just enough good news to keep the markets moving upward.
- The January labor report showed the economy created 304,000 new jobs, crushing expectations. The temporary government shutdown had little impact on the employment numbers.
- Reported corporate earnings have shown modest growth in the fourth quarter, with 67% exceeding EPS expectations and 62% topping revenue estimates. (This is with 84% of the S&P 500 reporting). Earnings estimates for the first quarter have been steadily coming down, but 2019 as a whole is expected to show 4.8% annual growth.
- Government shutdown 2.0 was adverted and the markets gladly put this worry in the rear view mirror.
- Trade tensions with China has had the market’s attention for a while. The self-imposed March 1 deadline for additional tariffs hung like a dark cloud until hints of a deal calmed fears. A late month tweet from President Trump, stated the deadline will be pushed forward as progress is being made on a trade deal.
- Retail sales and home sales disappointed retail sales by declining an unexpected 1.2% in December, the worst decline in nine years. Existing home sales were down 8.5% year over year, their worst report since November, 2015.
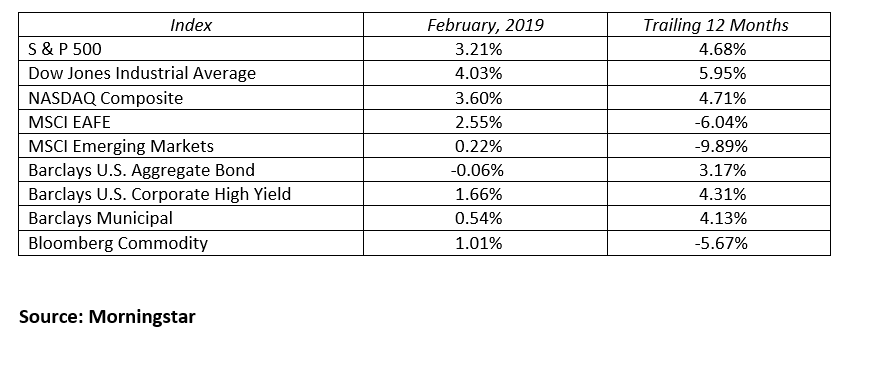
Despite some mixed economic news, stocks kept rolling as the Dow Jones Industrial Average, NASDAQ Composite and the S&P 500 gained 4.0%, 3.6%, and 3.2%, respectively, in February. International stocks appear cheaper than their U.S. counterparts based on valuations, but their economies are not expected to grow as strongly. International stocks still managed gains for the month as the MSCI EFAE and emerging markets indices rose 2.6% and 0.2%. International stocks, commodities and oil are the only major asset classes showing negative returns over the past 12 months.
The Federal Reserve is now clearly on hold until the second half of 2019. Interest rates and the shape of the yield curve should be relatively stable unless there are significant changes to economic growth forecasts or inflation. The entire U.S. Treasury yield curve traded in a very tight range during February. The 2, 5, 10 and 30-year U.S. Treasury benchmark securities closed the month yielding 2.52%, 2.52%, 2.73 and 3.09%, respectively. From January month-end, yields rose 7 to 10 basis points. The yield curve retained its relatively flat, but still upward sloping shape. The positive slope is good news for stocks and the overall economy as inverted yield curves have accurately predicted the last seven recessions.
Over the next several months, expect volatility to remain at current subdued levels as the markets digest economic news, future corporate earnings guidance, and any changes on the geopolitical front. With a second government shutdown averted, China trade headlines will take center stage. We remain constructive on the financial markets in 2019.
Our optimism comes from a variety of factors:
– The Federal Reserve has stepped out of the way allowing interest rates to remain stable and economic growth likely to continue.
– The U.S. economy (GDP) can continue to produce 2.0-2.5% growth.
– The threat of a near-term second U.S. government shutdown has been avoided.
– A resolution to the China trade dispute could be a bullish catalyst, whereas non-resolution is just more of the same and a postponement of an eventual solution.
– This year began with low asset prices and valuations, allowing room for upside potential.
There will be some bumps in the 2019 road, but do not let those bumps throw you off your financial course. One or two 10% stock market corrections during a given year is quite normal and we will likely see this happen sometime this year. Remind yourself to be patient and maintain a long-term focus. A three to five year time horizon is much more effective than daily, weekly or monthly portfolio checkpoints. Stay your course with confidence in your financial plan.
MARKETS BY THE NUMBERS:
To expand on these Market Commentaries or to discuss any of our investment portfolios, please do not hesitate to reach out to us at 775-674-2222